I'm trying to show the increase in the carbon output of each nation through time decade by decade, I have used a table join on the attribute table of a country boundry shape file and plotted the data in individual feature classes
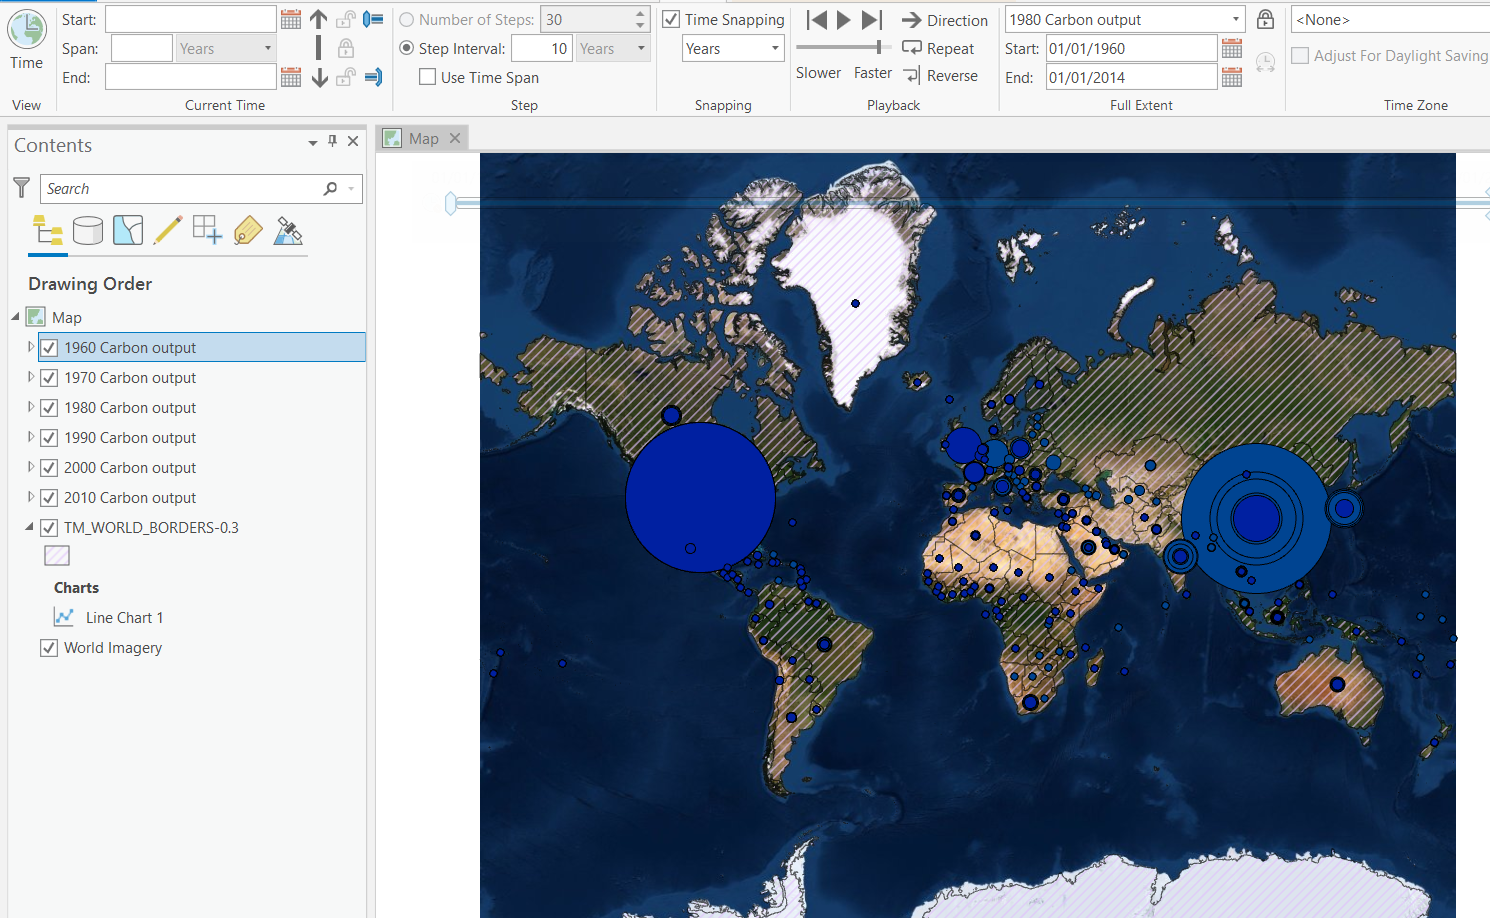
And enabled time on each individual layer, however i'm still having trouble to animate the changes through time
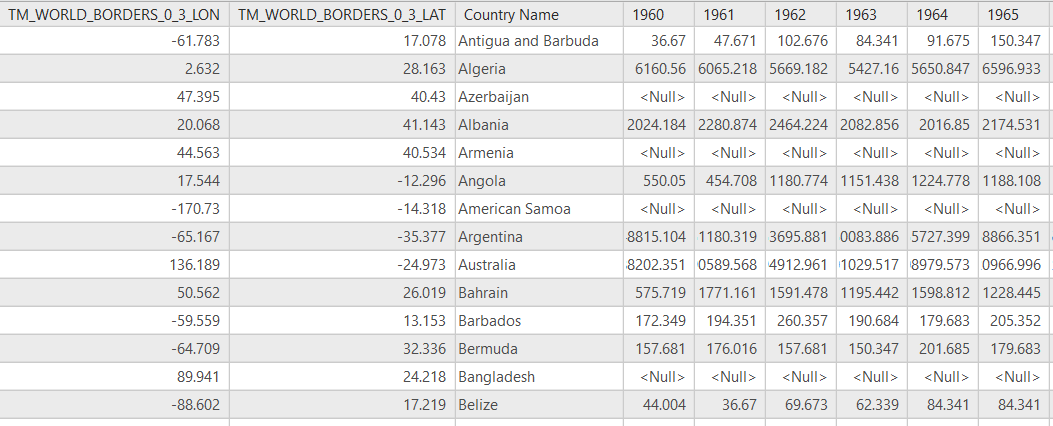
the attribute table for each feature class looks like this
I've looked online but i can't seem to find an answer to my question, any pointers would be very much appreciated




