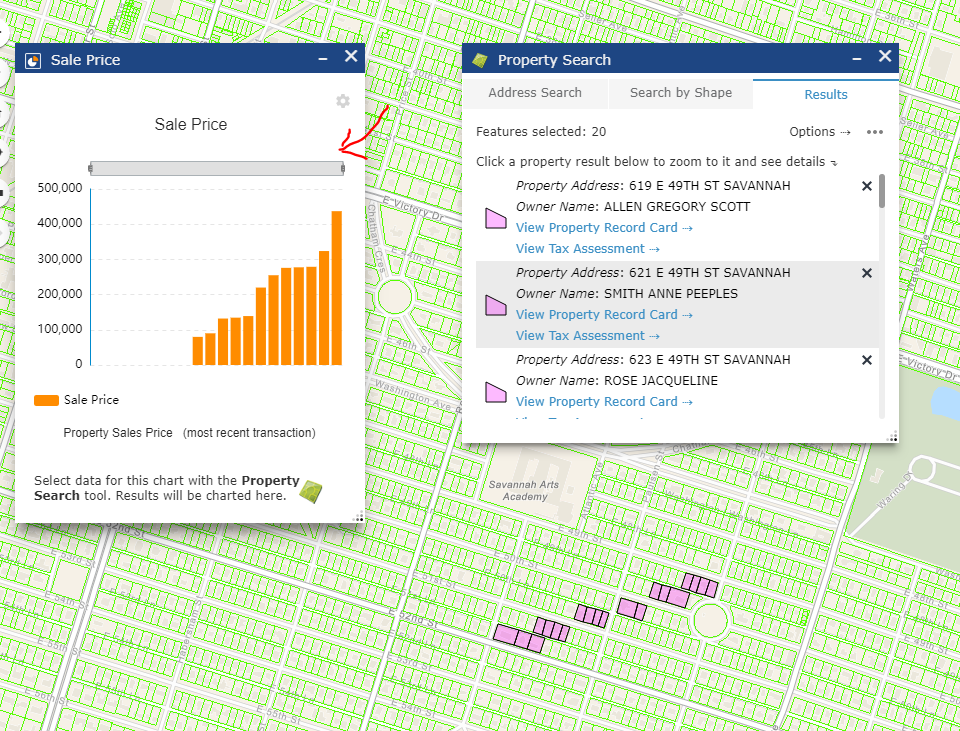
Why does Infographic not show all results (by default)? I am using the current WAB 2.12. I feed Robert's eSearch result to some Inofgraphic chart widgets to show things like Sale Price and Value for selected parcels.
By default it seems to have the sliders only show some of the columns. This will confuse users, I will have to create a text span note to tell them to expand them. https://public.sagis.org/sagisorg2019/
Is this a bug? Support said they did not know why it would do this.
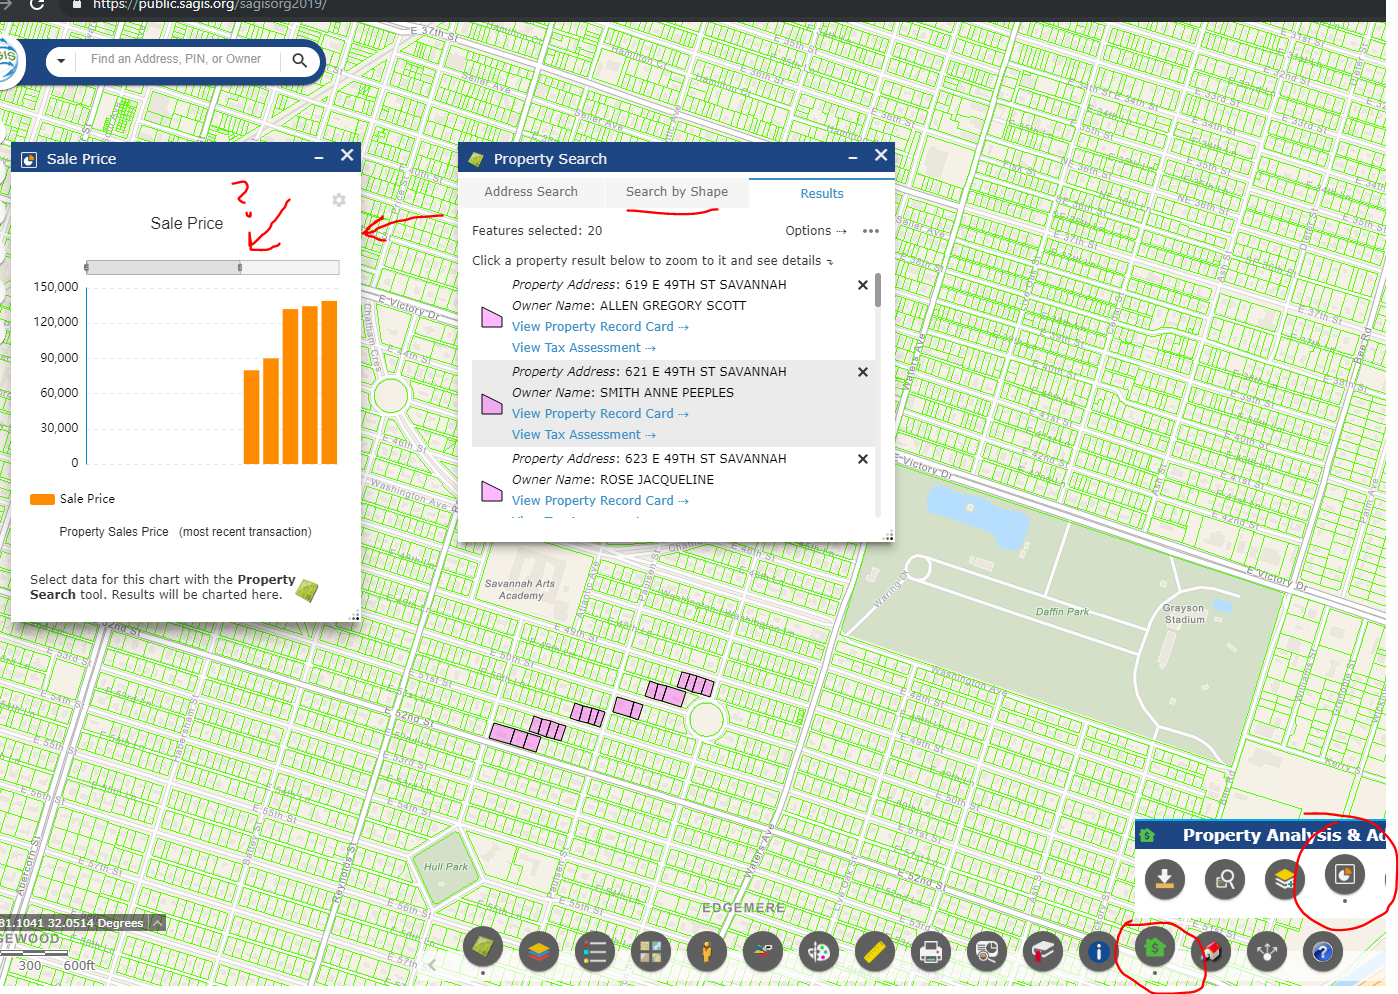
After expanding the sliders...