Hello, I am Arushi Kapoor, a PhD researcher and GIS enthusiast passionate about environmental data and spatial analysis. In this post, I explore how Geographic Information Systems strengthen water quality research while building career-ready skills that matter in today’s environmental and geospatial fields. Whether you are a student considering learning about GIS, an early career professional, or simply curious about how spatial data shapes environmental understanding, you will find practical insights and actionable steps to build expertise in this growing field.
Water quality studies generate substantial amounts of data across multiple sampling locations and time periods. While spreadsheets remain a standard tool for organizing that information, they have real limitations in identifying spatial patterns and relationships. Geographic Information Systems (GIS) address that gap by adding geographic context to environmental data, and in doing so, change how researchers interpret and communicate findings.
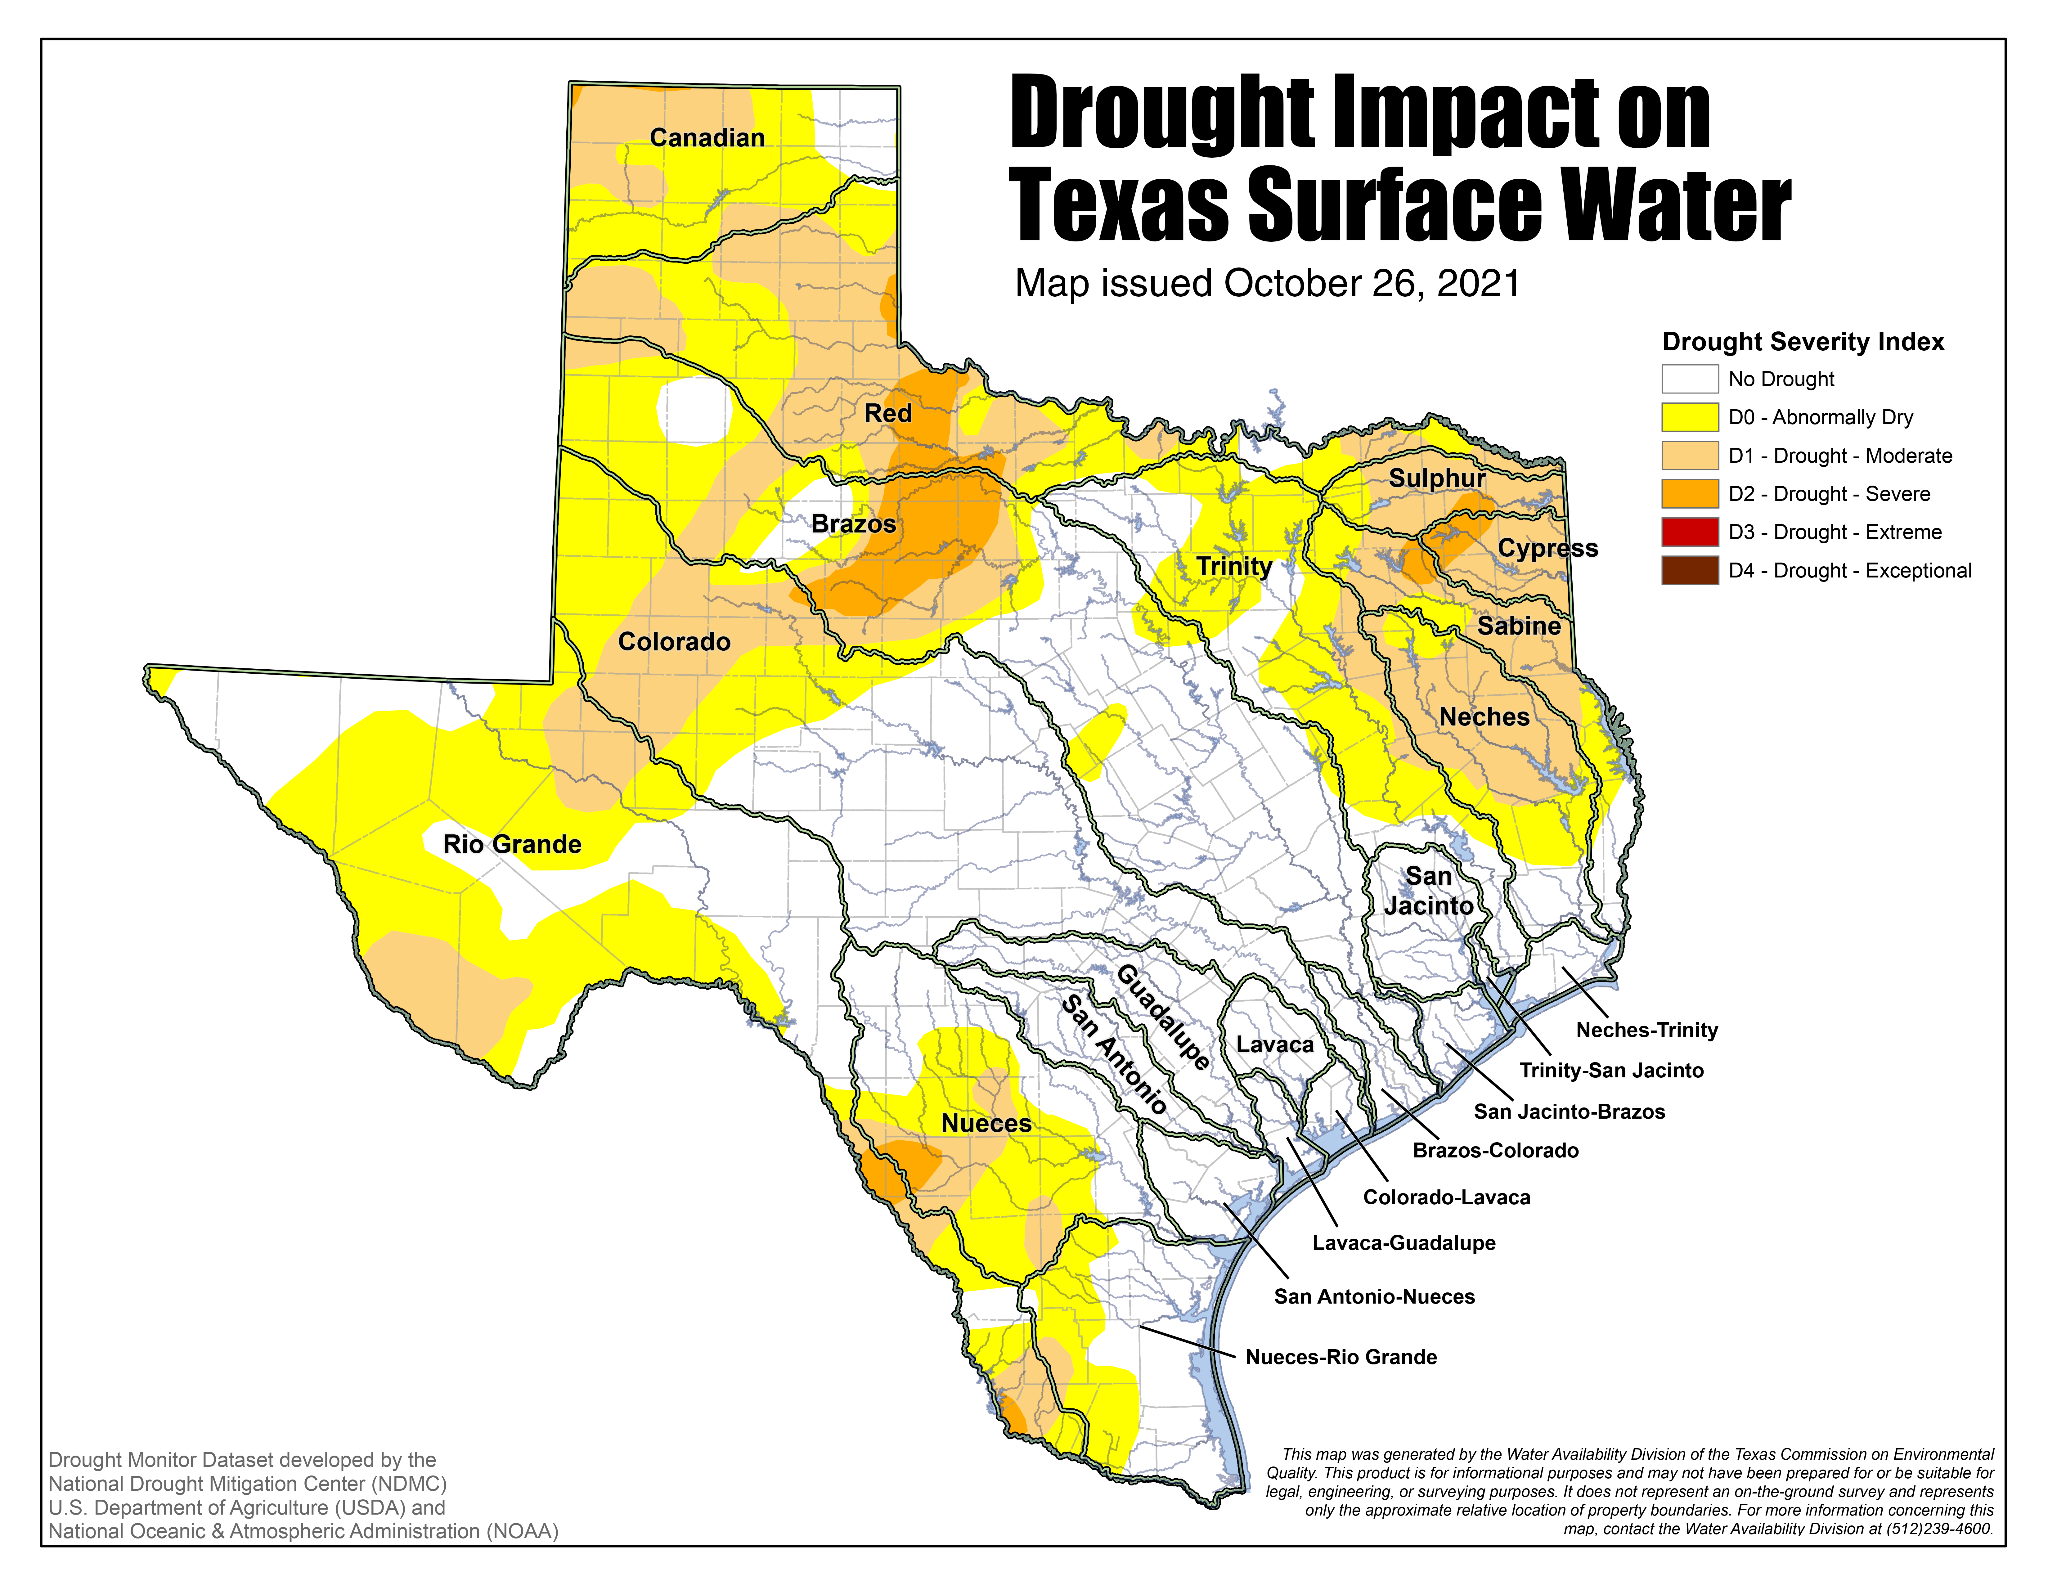
Figure 1: Drought severity mapped across Texas river basins and watersheds, illustrating how GIS integrates hydrological boundaries with environmental variables. Source: Texas Commission on Environmental Quality, Water Availability Division.
Turning Data Points Into Spatial Understanding
One of the core strengths of GIS in water quality research is its ability to reveal patterns that tabular data often hides. When sampling locations are mapped, clusters, gradients, and anomalies become visually apparent in ways that are difficult to detect in rows and columns alone. For researchers working across multiple sites, this spatial perspective is especially valuable. It shifts analysis from isolated observations to a more complete understanding of environmental conditions across a watershed or study area.
In water quality contexts, this matters because contamination sources, hydrological connections, and land use influences are inherently spatial. Mapping sampling results alongside variables such as precipitation, land cover, and infrastructure helps explain why certain sites behave differently, not just that they do.
Integrating Multiple Data Layers
A key advantage of using ArcGIS Pro and ArcGIS Online is the ability to bring together datasets from different sources into a single analytical framework. In water quality studies, this can include hydrological boundaries, land use classifications, population density, and infrastructure networks. Overlaying these layers with sampling data provides context that supports more targeted analysis and more defensible conclusions.
Precipitation data is one example where spatial integration adds significant value. When rainfall events are mapped alongside sampling results over time, it becomes possible to identify which locations show increased variability after storm events and which remain relatively stable. These spatial differences can inform monitoring priorities and support more efficient allocation of resources.
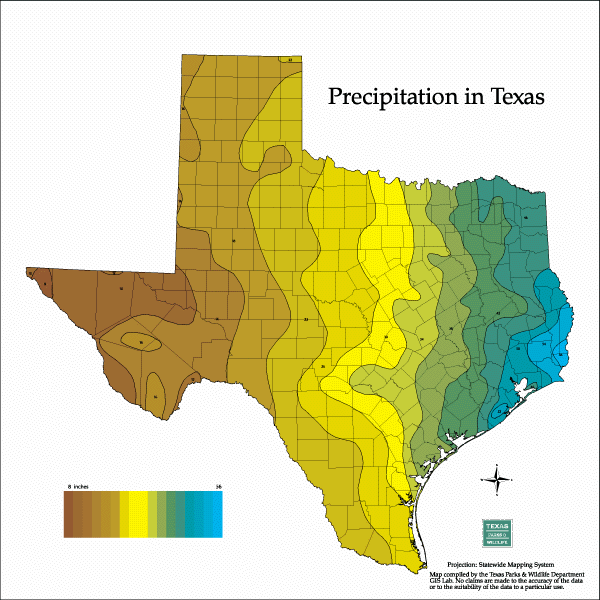
Figure 2: Statewide precipitation distribution across Texas, illustrating how spatial mapping reveals regional variability in rainfall patterns. Source: Texas Parks & Wildlife Department, GIS Lab, Statewide Mapping System.
Building In-Demand Skills for Early-Career Professionals
Beyond its research applications, developing GIS proficiency is increasingly valuable across environmental science, public health, consulting, and regulatory sectors. The ability to work with spatial data, design meaningful visualizations, and communicate geographic insights is a skill set that translates across many roles and industries.
For students and emerging professionals looking to build in this space, a few practical steps can make a strong foundation:
- Explore ArcGIS Online and ArcGIS Pro through hands-on projects using publicly available environmental datasets
- Practice communicating spatial insights through maps and visuals, not just analysis outputs
- Engage with communities like the Esri Young Professionals Network to connect with peers, find mentors, and develop leadership in the geospatial field
- Take advantage of Esri's learning paths and StoryMaps to build both technical and analytical depth
Connecting with peers through YPN and similar networks does more than expand a contact list. It exposes young professionals to how others are applying GIS across industries, sharpens communication skills, and creates opportunities to step into leadership through contributions like blog posts, events, and mentorship.
Looking Ahead
As water quality challenges become more complex, driven by climate variability, aging infrastructure, and competing land uses, spatial analysis will play an increasingly important role in how researchers and practitioners make sense of environmental data. GIS is not just a mapping tool. It is an analytical framework that connects location to meaning. For early-career professionals in environmental fields, developing this capability early creates a meaningful advantage in both research and practice.
Have questions about GIS for water quality research, or want to share your own experience with spatial analysis in environmental work? I would like to hear your thoughts in the comments below. Feel free to connect with me on LinkedIn. Let's continue this conversation and grow together in the geospatial community!




