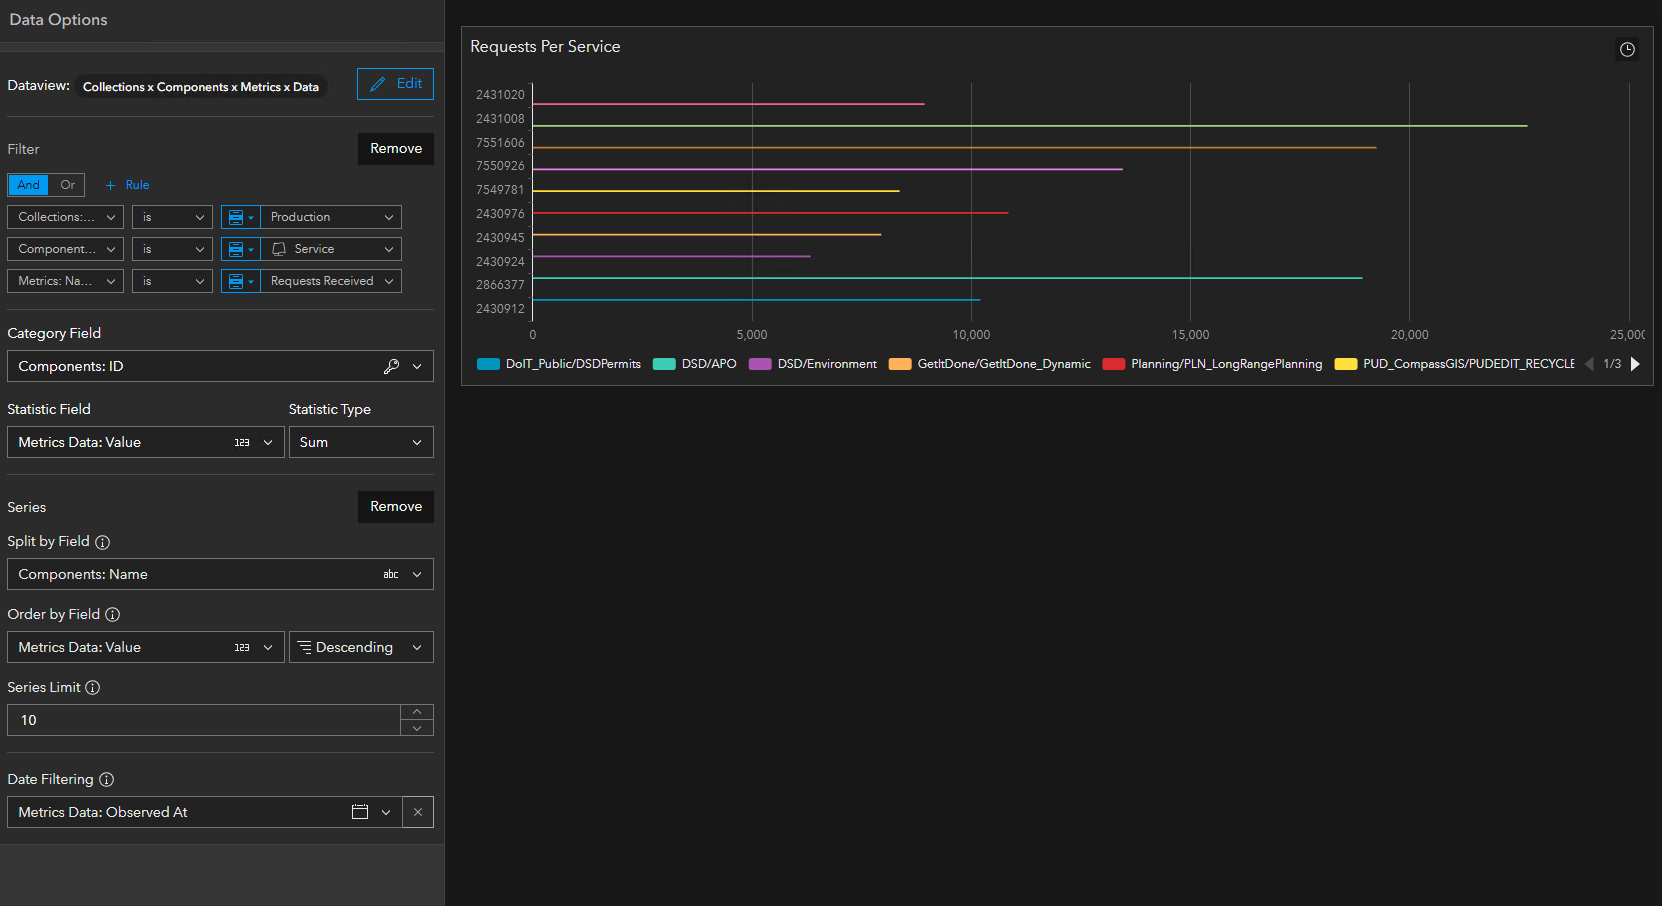
I'm attempting to make a chart showing the total requests received per service over a time period. When I use the Component ID as the Category Field, this works as I expect, but Component ID means nothing and it's cumbersome to mouseover to see a label or go through the legend items.
If I use Component Name, the chart automatically sets the maximum value at 100.
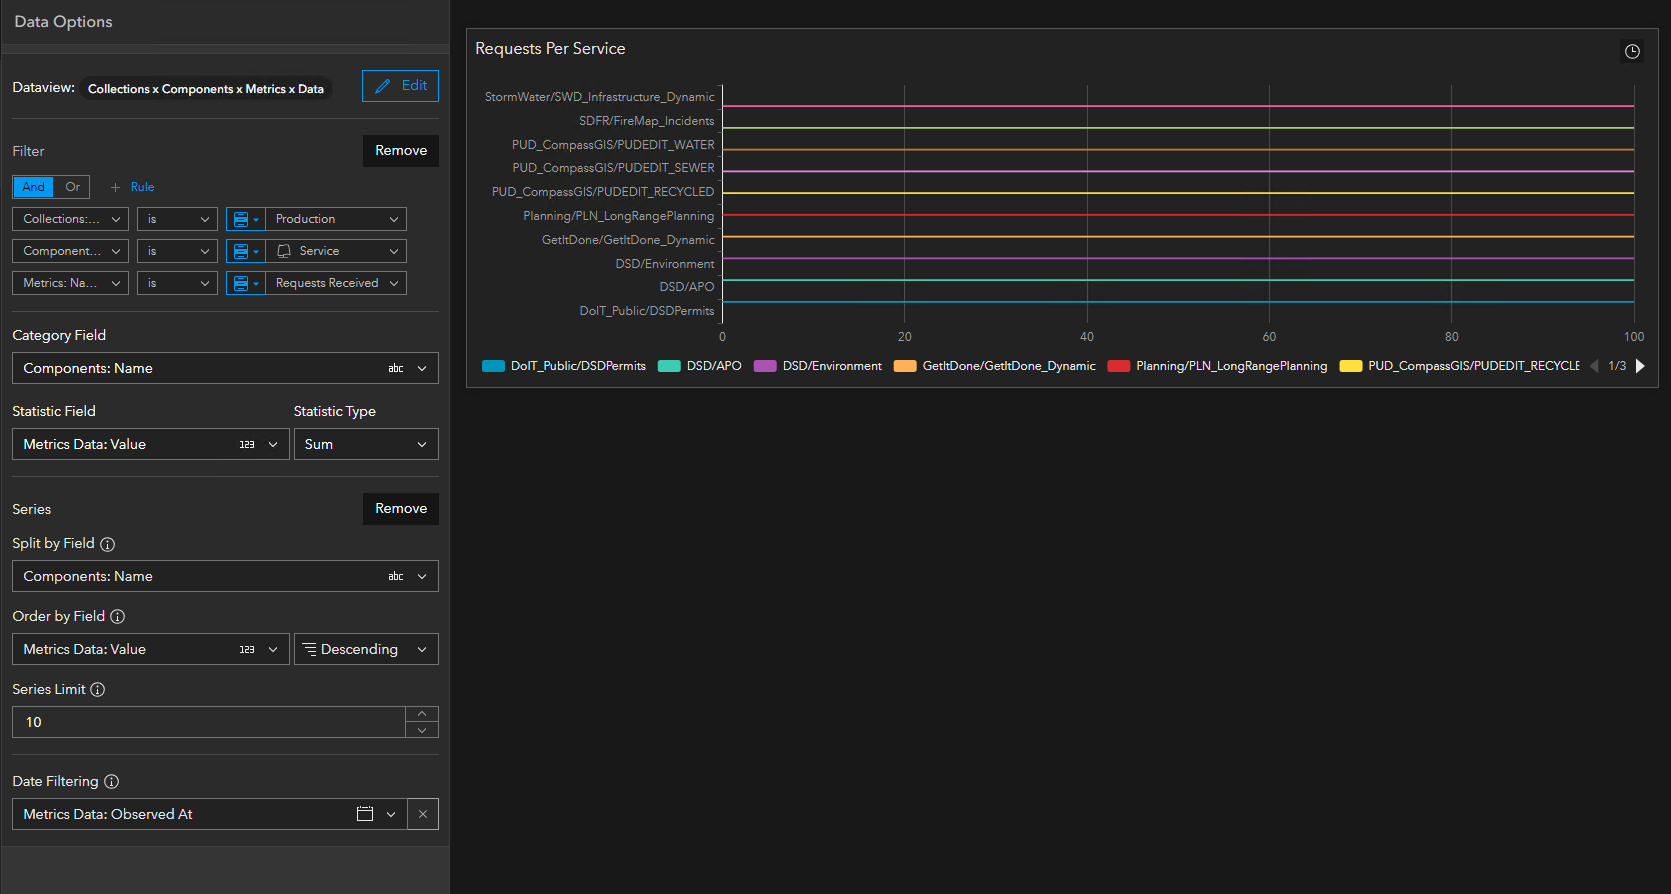
Is this expected behavior or a bug? Is there a different way to get what I'm looking for?

