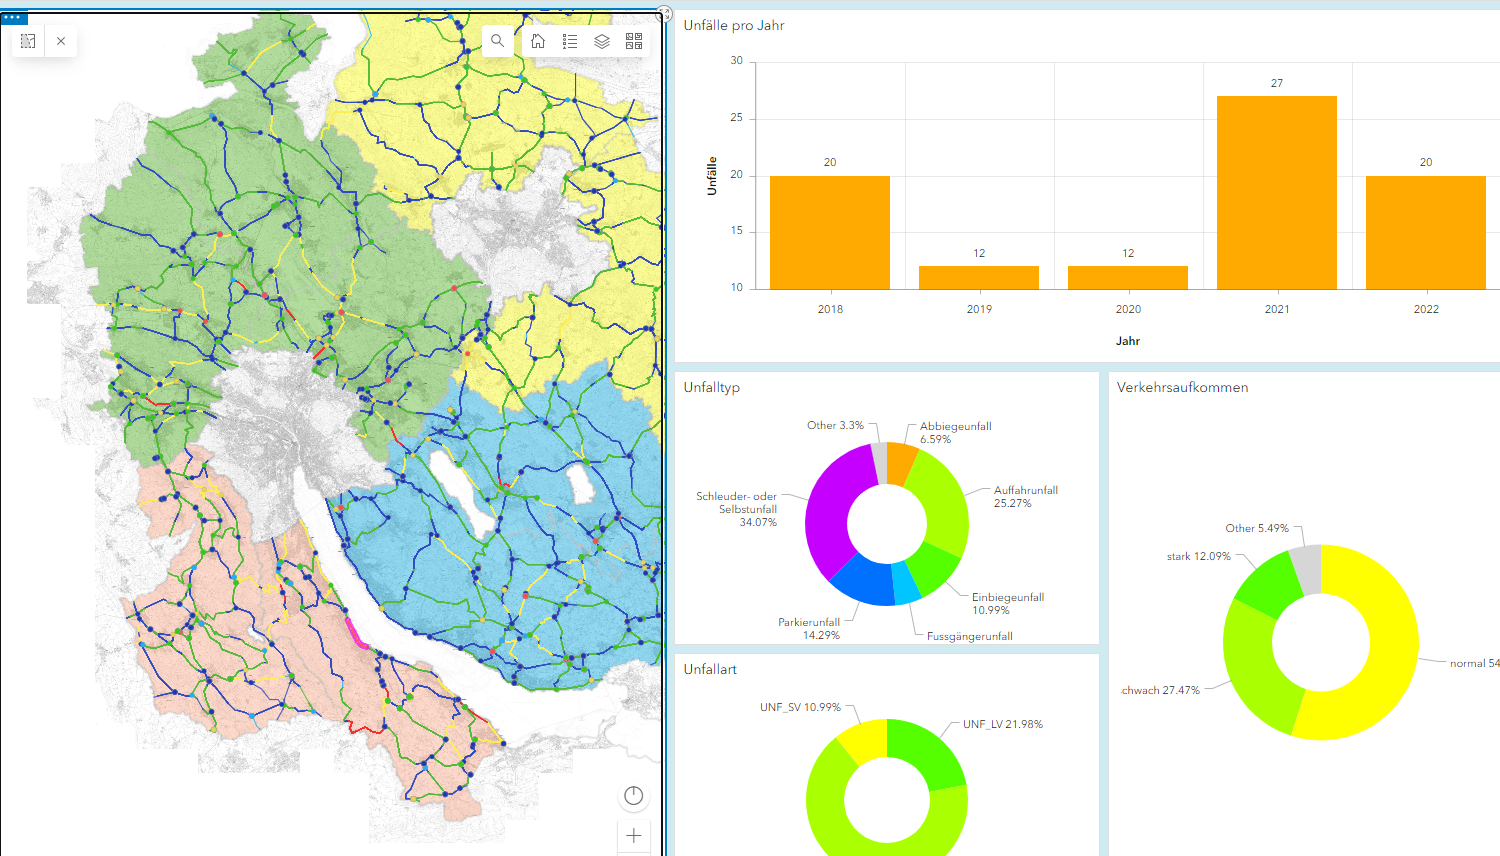
I have an ArcGIS online Map with two layers, one with streets and the other one with street knodes. The have the same structure/col-names in the attribute table (each over 1000 entries).
In my Dashboard I want to display charts of details, depending on the street or knodes I select in the Dashboard map. If nothing is selected the charts should display the information of the visible section of the mapof the streets and knodes combined. How do I connect the layers that they are visible in the same chart depending on the selection. Any tips? Attached you find a screenshot of the dashboard so far, where I only used the streets for the charts. One streest is selected (pink) and the charts currently display only the info of that street