Hi all,
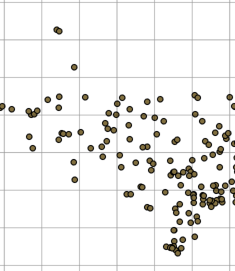
I'm fairly new to ArcGIS PRO and would appreciate some help walking me through this. Please see the images below for reference.
I have a map with a grid system on it and a density map of data points. I want to create a value for each grid showing how dense the features are in each grid, e.g., ., 0=nothing > 20=extremely dense. Something which I can then colour appropriately in symbology.
How do I go about doing this? Seems like it should be fairly simple but I do not know the procedures. Any help you can give me would be amazing, thank you.