Hello, I am trying to display some survey results in a dashboard. The question is ranked choice and I'm trying to replicate the chart shown in Survey123 Analyze -- where it gets the average "score" for each of the ranked choices. I have not been able to embed the analyze results in a way that I like, so now I'm trying to replicate using data expressions. The end result I'm looking for is a dictionary/array with a row for each of the unique choices, a column for each of the ranks, and a count in each field representing how many times that choice was ranked that number, as well as a final column representing the average. Below is an example of the input data
| FeatureID | RankChoiceList |
| 1 | Apple,Banana,Orange |
| 2 | Apple,Orange,Banana |
| 3 | Orange,Apple,Banana |
| 4 | Banana,Apple,Orange |
| 5 | Apple,Banana,Orange |
Now an example of the desired result, the average is calculated by: [(1st Choice Count * 3) + (2nd Choice Count * 2) + (3rd Choice Count * 1)] / [# of Features]
| Choice | 1st Choice | 2nd Choice | 3rd Choice | Average |
| Apple | 3 | 2 | 0 | 2.6 |
| Banana | 1 | 2 | 2 | 1.8 |
| Orange | 1 | 1 | 3 | 1.6 |
Now for the Arcade, this is my thought process followed by what I have so far:
First I'd like to split the RankChoiceList Column into three columns (1st, 2nd and 3rd) where the order of the comma-separated values matters -- first value in the 1st choice, second value in the 2nd choice, etc..
| FeatureID | 1st Choice | 2nd Choice | 3rd Choice |
| 1 | Apple | Banana | Orange |
| 2 | Apple | Orange | Banana |
| 3 | Orange | Apple | Banana |
| 4 | Banana | Apple | Orange |
| 5 | Apple | Banana | Orange |
Then I would like to get counts of each of the unique choices for every rank (a total of 3 tables for each of the three choices)
| Choice | 1st Choice |
| Apple | 3 |
| Banana | 1 |
| Orange | 1 |
Then I'd like to combine these tables and calculate the average -- resulting in the desired result table from above.
I have laid out my whole thought process in case there are suggestions of ways to do it better, however I am stuck on the first step. My code below returns a dictionary with the appropriate number of features and appropriate fields, but all of them return the same feature (objectId 19 and the corresponding ranks)
// Reference layer using the FeatureSetByPortalItem() function.
var fs = FeatureSetByPortalItem(Portal('https://www.arcgis.com'), '2284118eba59466e9169133c458ef9d4' , 0, ['nodes','character_qualities','development_priorities','objectid'], false);

// Empty dictionary to capture each hazard reported as separate rows.
var choicesDict = {'fields': [{'name':'oid','type':'esriFieldTypeString'},{ 'name': 'split_choices', 'type': 'esriFieldTypeString'},{ 'name': 'first_choice', 'type': 'esriFieldTypeString'},{ 'name': 'second_choice', 'type': 'esriFieldTypeString'},{ 'name': 'third_choice', 'type': 'esriFieldTypeString'},{ 'name': 'fourth_choice', 'type': 'esriFieldTypeString'},{ 'name': 'fifth_choice', 'type': 'esriFieldTypeString'},{ 'name': 'sixth_choice', 'type': 'esriFieldTypeString'}],
                    'geometryType': '', 'features': []};

var index = 0;

// Split comma separated hazard types and store in dictionary.
for (var feature in fs) {
    var split_array  =  Split(feature["development_priorities"], ',')
    var count_arr = Count(fs)
    for(var i = 0; i < count_arr; i++ ){
        choicesDict.features[i] = {
            'attributes': { //'split_choices': Trim(split_array[i]),
            'first_choice':split_array[0],'oid':feature.objectid,'second_choice':split_array[1],'third_choice':split_array[2],'fourth_choice':split_array[3],'fifth_choice':split_array[4],'sixth_choice':split_array[5]}}
}}
return choicesDict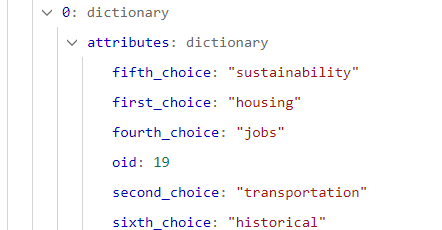
My question is: how can I modify my code to successfully translate the choices into the appropriate columns and/or what would be a better way to do this?



