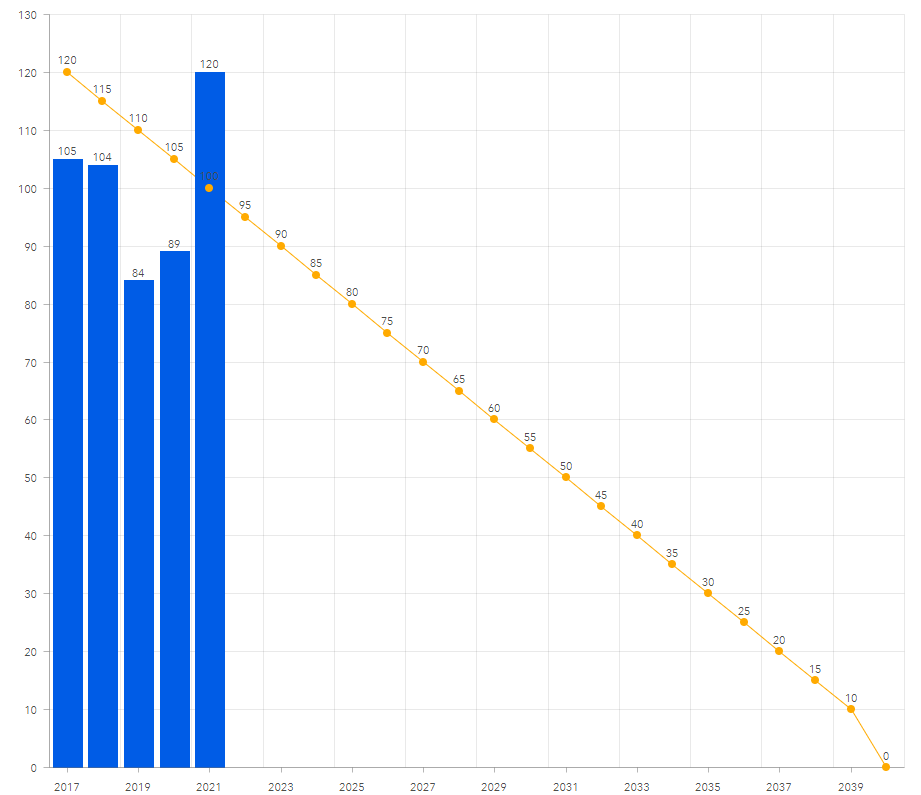
I need to create a line chart with two lines: one with actual numbers and another one that represents a downward trend to 0. Like this:
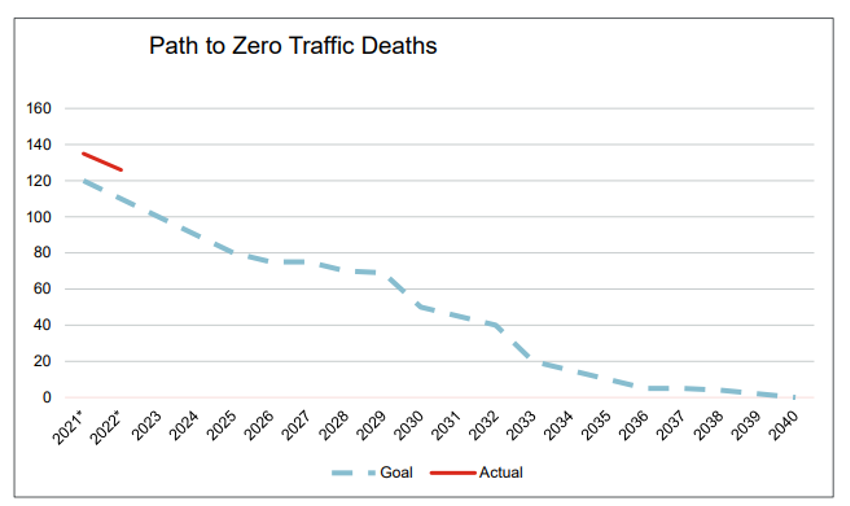
Dashboard has the option of converting bar charts to line but is there a way to show two different lines? instead of one bar and one line, like below