Hello,
I'm having an issue with creating a scatter plot in ArcGIS Pro. I'd like to create a similar output to the multiple grids in this article: https://pro.arcgis.com/en/pro-app/latest/help/analysis/geoprocessing/charts/scatter-plot.htm#ESRI_SECTION1_0CCFFED84E2643EEA80685BE8A2BCEBB
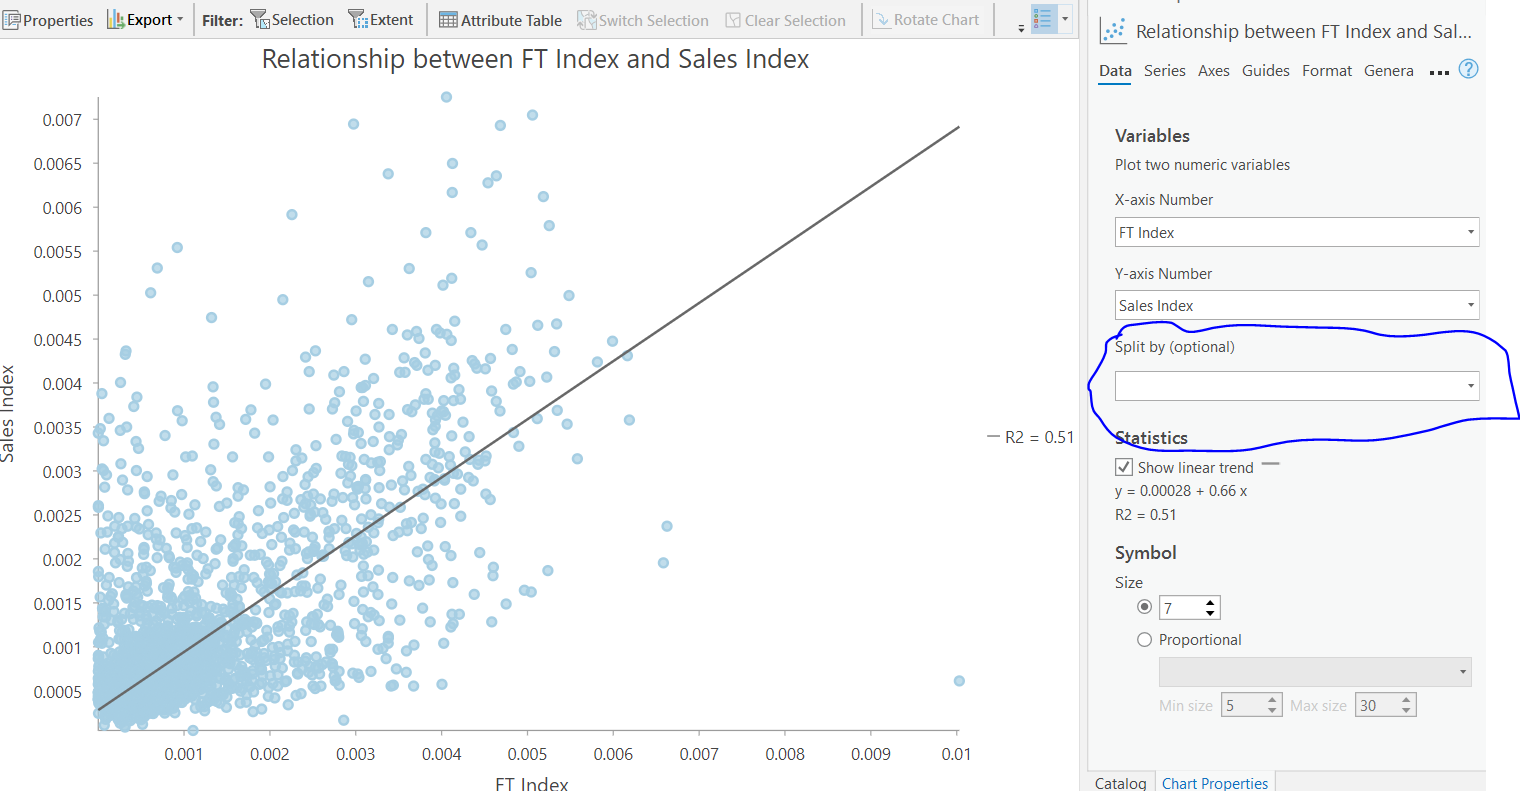
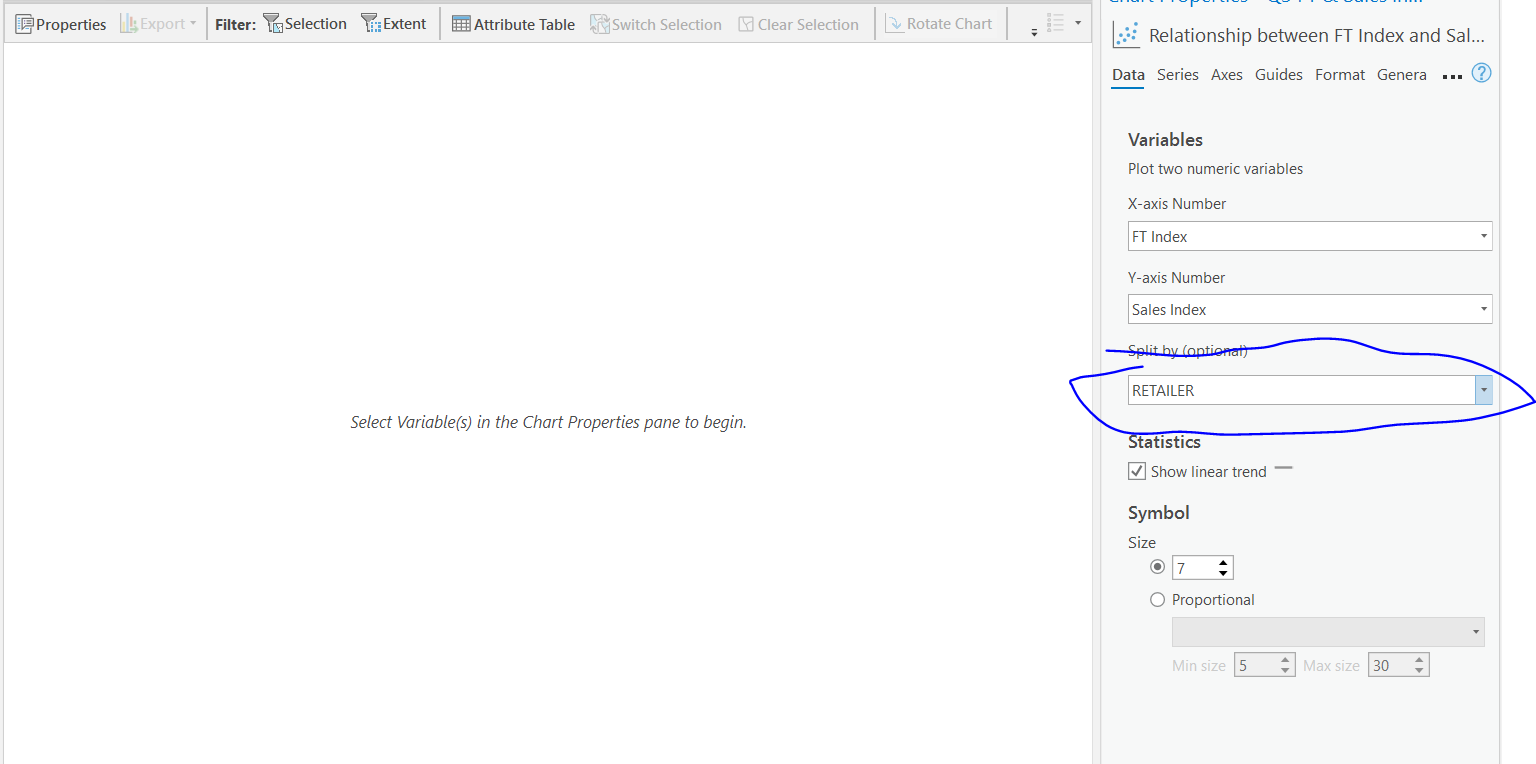
I'm able to create a scatter plot with all of the data in my table, but when I select a string variable to split by, I get 'Select Variable(s) in the Chart Properties pane to begin.' instead of an actual graph. See screenshots below for the two results
Before splitting by a variable:
After splitting by a variable:
Does anyone know how to fix this issue?
Thanks.