Hello Everbody!
1 - I want create my infographics using points and not services areas or other radial circles.It´s Possible?
If not possible, step to the next remaining questions.
2 - I have 1500 attributes, will I have to create custom infographics for each one, or is there a dynamic formula like there are in the pop-ups config?
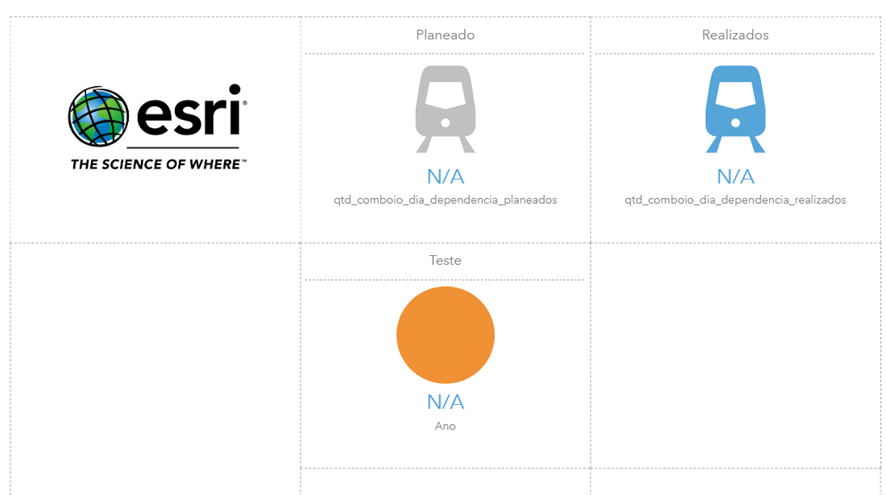
3 - Why do my variables appear as follows? You can see the image below.
Best regards



