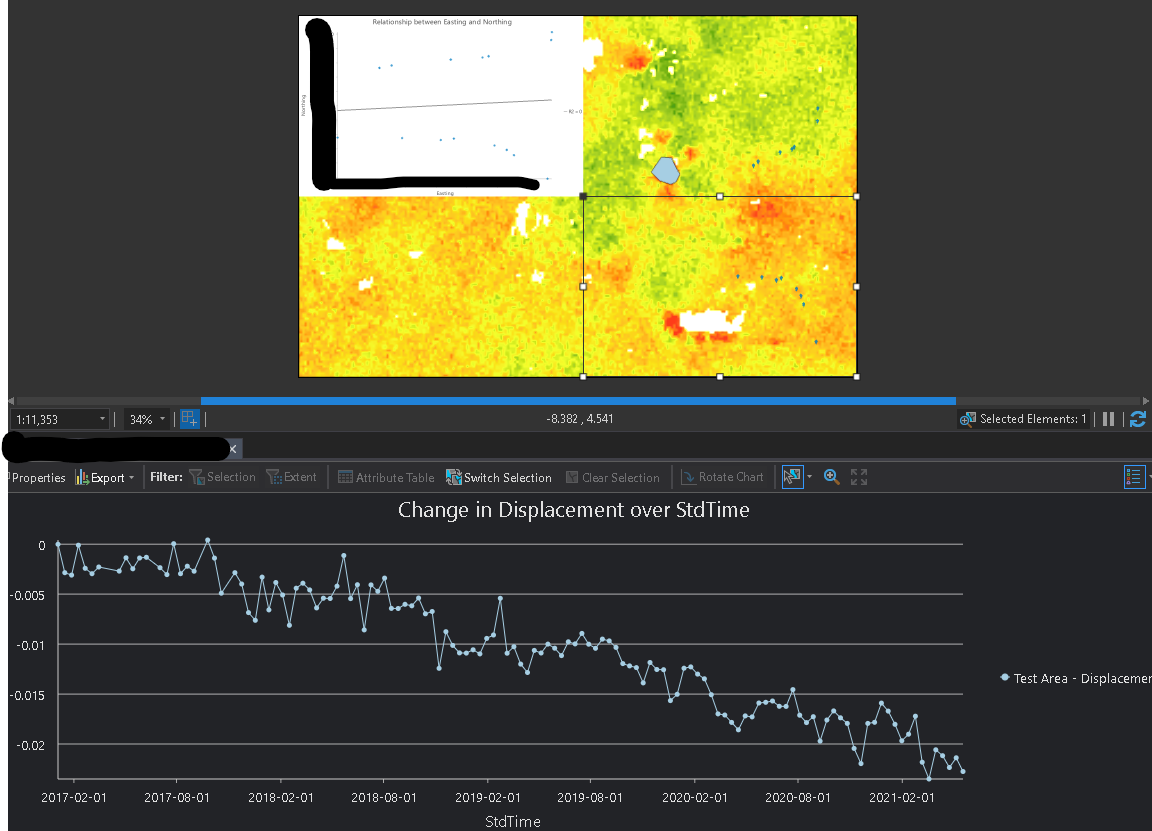
I have a temporal profile chart created from a multidimensional mosaic dataset. Each raster in the dataset has a single band showing the displacements measured for a given pass of the satellite. The chart itself looks fine (see chart at the bottom of the image below). However, when I add it to a layout, the chart frame is blank (see empty frame in the bottom right corner of the layout window). I can see the polygon that I digitized when defining an area of interest, but not the chart (see blue polygon just above the empty frame). Just to be sure, I added another (meaningless) chart to the layout that was created from some point data. As can be seen, the chart from the point data is visible, but the chart from the mosaic dataset is not. Is this a know issue? Is there something I need to do differently when adding a chart from a mosaic dataset? This is in ArcGIS Pro 2.8.