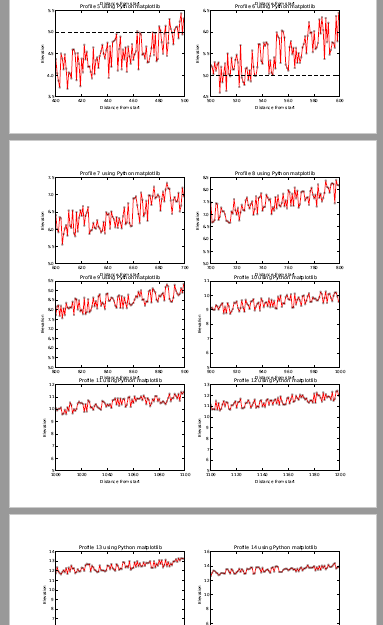
A while ago I uploaded a document Using Python and matplotlib to create profile graphs and recently there was a question about how to create a PDF with multiple graphs on a single page. In this case I am taking it a little step further and will create a multi page PDF file that will contain 6 graphs on each page base on a combination of suggestions made at this page: matplotlib - Python saving multiple figures into one PDF file - Stack Overflow .
This is what I came up with:
- It will create subplots to put multiple figures on the same page and the backend_pdf to create a multi pages PDF
- I create some random data (you will have to point to the real data is needed for the graphs). In my case I created a nested list with 5000 lists and each list contains d, z and zv as in the example
- The function chunks will be able to divide the list in chunks, in my case chunks of 600, since I want to create 6 graphs per page and each graph contains 100 data points.
- Each chunk of 600 items is divided in chunks of 100 items to create the graphs for each page
When using subplots, it is important to specify the correct value for rows, cols and plot number. On line 22 you can see the number "321". This represents 3 rows, 2 columns and plot number is 1 (the first one). For every chunk of 100 data points a graph is created and each graph should have its correct plot number, which is why the plot number is incremented for each chunk of 100 data points (line 42).
The chunk size "600" on line 21 in combination with the smaller chunks created on line 24 generate 6 graphs, which correspond to the value 321, where 3 * 2 + results in 6 graphs.
<SPAN class="keyword token">import</SPAN> matplotlib<SPAN class="punctuation token">.</SPAN>backends<SPAN class="punctuation token">.</SPAN>backend_pdf
<SPAN class="keyword token">import</SPAN> matplotlib<SPAN class="punctuation token">.</SPAN>pyplot <SPAN class="keyword token">as</SPAN> plt
<SPAN class="keyword token">import</SPAN> random
<SPAN class="keyword token">def</SPAN> <SPAN class="token function">chunks</SPAN><SPAN class="punctuation token">(</SPAN>l<SPAN class="punctuation token">,</SPAN> n<SPAN class="punctuation token">)</SPAN><SPAN class="punctuation token">:</SPAN>
<SPAN class="string token">"""Yield successive n-sized chunks from l."""</SPAN>
<SPAN class="keyword token">for</SPAN> i <SPAN class="keyword token">in</SPAN> range<SPAN class="punctuation token">(</SPAN><SPAN class="number token">0</SPAN><SPAN class="punctuation token">,</SPAN> len<SPAN class="punctuation token">(</SPAN>l<SPAN class="punctuation token">)</SPAN><SPAN class="punctuation token">,</SPAN> n<SPAN class="punctuation token">)</SPAN><SPAN class="punctuation token">:</SPAN>
<SPAN class="keyword token">yield</SPAN> l<SPAN class="punctuation token">[</SPAN>i<SPAN class="punctuation token">:</SPAN>i <SPAN class="operator token">+</SPAN> n<SPAN class="punctuation token">]</SPAN>
<SPAN class="comment token"># settings</SPAN>
out_pdf <SPAN class="operator token">=</SPAN> r<SPAN class="string token">'C:\GeoNet\Profiles2PDF\test3.pdf'</SPAN>
<SPAN class="comment token"># some random data</SPAN>
data <SPAN class="operator token">=</SPAN> <SPAN class="punctuation token">[</SPAN><SPAN class="punctuation token">]</SPAN>
<SPAN class="keyword token">for</SPAN> i <SPAN class="keyword token">in</SPAN> range<SPAN class="punctuation token">(</SPAN><SPAN class="number token">0</SPAN><SPAN class="punctuation token">,</SPAN> <SPAN class="number token">5000</SPAN><SPAN class="punctuation token">)</SPAN><SPAN class="punctuation token">:</SPAN>
data<SPAN class="punctuation token">.</SPAN>append<SPAN class="punctuation token">(</SPAN><SPAN class="punctuation token">[</SPAN>i<SPAN class="punctuation token">,</SPAN> float<SPAN class="punctuation token">(</SPAN>i <SPAN class="operator token">+</SPAN> random<SPAN class="punctuation token">.</SPAN>randrange<SPAN class="punctuation token">(</SPAN><SPAN class="operator token">-</SPAN><SPAN class="number token">50</SPAN><SPAN class="punctuation token">,</SPAN> <SPAN class="number token">50</SPAN><SPAN class="punctuation token">)</SPAN><SPAN class="punctuation token">)</SPAN><SPAN class="operator token">/</SPAN><SPAN class="number token">100</SPAN><SPAN class="punctuation token">,</SPAN> <SPAN class="number token">5</SPAN><SPAN class="punctuation token">]</SPAN><SPAN class="punctuation token">)</SPAN>
pdf <SPAN class="operator token">=</SPAN> matplotlib<SPAN class="punctuation token">.</SPAN>backends<SPAN class="punctuation token">.</SPAN>backend_pdf<SPAN class="punctuation token">.</SPAN>PdfPages<SPAN class="punctuation token">(</SPAN>out_pdf<SPAN class="punctuation token">)</SPAN>
cnt <SPAN class="operator token">=</SPAN> <SPAN class="number token">0</SPAN>
figs <SPAN class="operator token">=</SPAN> plt<SPAN class="punctuation token">.</SPAN>figure<SPAN class="punctuation token">(</SPAN><SPAN class="punctuation token">)</SPAN>
<SPAN class="keyword token">for</SPAN> data_chunk <SPAN class="keyword token">in</SPAN> chunks<SPAN class="punctuation token">(</SPAN>data<SPAN class="punctuation token">,</SPAN> <SPAN class="number token">600</SPAN><SPAN class="punctuation token">)</SPAN><SPAN class="punctuation token">:</SPAN>
plot_num <SPAN class="operator token">=</SPAN> <SPAN class="number token">321</SPAN>
fig <SPAN class="operator token">=</SPAN> plt<SPAN class="punctuation token">.</SPAN>figure<SPAN class="punctuation token">(</SPAN>figsize<SPAN class="operator token">=</SPAN><SPAN class="punctuation token">(</SPAN><SPAN class="number token">10</SPAN><SPAN class="punctuation token">,</SPAN> <SPAN class="number token">10</SPAN><SPAN class="punctuation token">)</SPAN><SPAN class="punctuation token">)</SPAN> <SPAN class="comment token"># inches</SPAN>
<SPAN class="keyword token">for</SPAN> sub_chunk <SPAN class="keyword token">in</SPAN> chunks<SPAN class="punctuation token">(</SPAN>data_chunk<SPAN class="punctuation token">,</SPAN> <SPAN class="number token">100</SPAN><SPAN class="punctuation token">)</SPAN><SPAN class="punctuation token">:</SPAN>
cnt <SPAN class="operator token">+=</SPAN> <SPAN class="number token">1</SPAN>
d <SPAN class="operator token">=</SPAN> <SPAN class="punctuation token">[</SPAN>a<SPAN class="punctuation token">[</SPAN><SPAN class="number token">0</SPAN><SPAN class="punctuation token">]</SPAN> <SPAN class="keyword token">for</SPAN> a <SPAN class="keyword token">in</SPAN> sub_chunk<SPAN class="punctuation token">]</SPAN>
z <SPAN class="operator token">=</SPAN> <SPAN class="punctuation token">[</SPAN>a<SPAN class="punctuation token">[</SPAN><SPAN class="number token">1</SPAN><SPAN class="punctuation token">]</SPAN> <SPAN class="keyword token">for</SPAN> a <SPAN class="keyword token">in</SPAN> sub_chunk<SPAN class="punctuation token">]</SPAN>
zv <SPAN class="operator token">=</SPAN> <SPAN class="punctuation token">[</SPAN>a<SPAN class="punctuation token">[</SPAN><SPAN class="number token">2</SPAN><SPAN class="punctuation token">]</SPAN> <SPAN class="keyword token">for</SPAN> a <SPAN class="keyword token">in</SPAN> sub_chunk<SPAN class="punctuation token">]</SPAN>
<SPAN class="keyword token">print</SPAN> plot_num
plt<SPAN class="punctuation token">.</SPAN>subplot<SPAN class="punctuation token">(</SPAN>plot_num<SPAN class="punctuation token">)</SPAN>
<SPAN class="comment token"># plot profile, define styles</SPAN>
plt<SPAN class="punctuation token">.</SPAN>plot<SPAN class="punctuation token">(</SPAN>d<SPAN class="punctuation token">,</SPAN>z<SPAN class="punctuation token">,</SPAN><SPAN class="string token">'r'</SPAN><SPAN class="punctuation token">,</SPAN>linewidth<SPAN class="operator token">=</SPAN><SPAN class="number token">0.75</SPAN><SPAN class="punctuation token">)</SPAN>
plt<SPAN class="punctuation token">.</SPAN>plot<SPAN class="punctuation token">(</SPAN>d<SPAN class="punctuation token">,</SPAN>z<SPAN class="punctuation token">,</SPAN><SPAN class="string token">'ro'</SPAN><SPAN class="punctuation token">,</SPAN>alpha<SPAN class="operator token">=</SPAN><SPAN class="number token">0.3</SPAN><SPAN class="punctuation token">,</SPAN> markersize<SPAN class="operator token">=</SPAN><SPAN class="number token">3</SPAN><SPAN class="punctuation token">)</SPAN>
plt<SPAN class="punctuation token">.</SPAN>plot<SPAN class="punctuation token">(</SPAN>d<SPAN class="punctuation token">,</SPAN>zv<SPAN class="punctuation token">,</SPAN><SPAN class="string token">'k--'</SPAN><SPAN class="punctuation token">,</SPAN>linewidth<SPAN class="operator token">=</SPAN><SPAN class="number token">0.5</SPAN><SPAN class="punctuation token">)</SPAN>
plt<SPAN class="punctuation token">.</SPAN>xlabel<SPAN class="punctuation token">(</SPAN><SPAN class="string token">'Distance from start'</SPAN><SPAN class="punctuation token">)</SPAN>
plt<SPAN class="punctuation token">.</SPAN>ylabel<SPAN class="punctuation token">(</SPAN><SPAN class="string token">'Elevation'</SPAN><SPAN class="punctuation token">)</SPAN>
plt<SPAN class="punctuation token">.</SPAN>title<SPAN class="punctuation token">(</SPAN><SPAN class="string token">'Profile {0} using Python matplotlib'</SPAN><SPAN class="punctuation token">.</SPAN>format<SPAN class="punctuation token">(</SPAN>cnt<SPAN class="punctuation token">)</SPAN><SPAN class="punctuation token">)</SPAN>
<SPAN class="comment token"># change font size</SPAN>
plt<SPAN class="punctuation token">.</SPAN>rcParams<SPAN class="punctuation token">.</SPAN>update<SPAN class="punctuation token">(</SPAN><SPAN class="punctuation token">{</SPAN><SPAN class="string token">'font.size'</SPAN><SPAN class="punctuation token">:</SPAN> <SPAN class="number token">8</SPAN><SPAN class="punctuation token">}</SPAN><SPAN class="punctuation token">)</SPAN>
plot_num <SPAN class="operator token">+=</SPAN> <SPAN class="number token">1</SPAN>
pdf<SPAN class="punctuation token">.</SPAN>savefig<SPAN class="punctuation token">(</SPAN>fig<SPAN class="punctuation token">)</SPAN>
pdf<SPAN class="punctuation token">.</SPAN>close<SPAN class="punctuation token">(</SPAN><SPAN class="punctuation token">)</SPAN>
<SPAN class="line-numbers-rows"><SPAN></SPAN><SPAN></SPAN><SPAN></SPAN><SPAN></SPAN><SPAN></SPAN><SPAN></SPAN><SPAN></SPAN><SPAN></SPAN><SPAN></SPAN><SPAN></SPAN><SPAN></SPAN><SPAN></SPAN><SPAN></SPAN><SPAN></SPAN><SPAN></SPAN><SPAN></SPAN><SPAN></SPAN><SPAN></SPAN><SPAN></SPAN><SPAN></SPAN><SPAN></SPAN><SPAN></SPAN><SPAN></SPAN><SPAN></SPAN><SPAN></SPAN><SPAN></SPAN><SPAN></SPAN><SPAN></SPAN><SPAN></SPAN><SPAN></SPAN><SPAN></SPAN><SPAN></SPAN><SPAN></SPAN><SPAN></SPAN><SPAN></SPAN><SPAN></SPAN><SPAN></SPAN><SPAN></SPAN><SPAN></SPAN><SPAN></SPAN><SPAN></SPAN><SPAN></SPAN><SPAN></SPAN><SPAN></SPAN><SPAN></SPAN><SPAN></SPAN></SPAN>See below an extract from the resulting PDF file:
In case you want to implement this for elevation data and chunks of 100 meter from a line, you can use Polyline::segmentAlongLine to get the chunks for each graph and Polyline::positionAlongLine to get each individual point on each segment.


