Not being a regular user of pandas/numpy I find using such libraries difficult as I cannot visualise what I'm working with... call me old skool...
I recently came across dtale a rather cool python module that displays the data and allows you to manipulate it as if it was a spreadsheet. It also has a set of rather impressive methods for charting your data.
I immediately thought it would be great to use this inside ArcPro, using the notebook capability built right into ArcPro 2.5!
- If you have not already done so you need to upgrade to ArcPro 2.5 as this version supports notebooks.
- First of all you need to clone your environment, I talk you through this process on this blog page whilst setting up spyder to work with ArcPro.
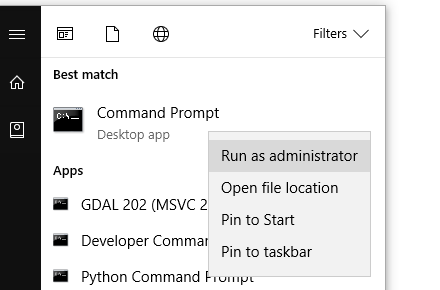
- Cloning creates a copy with all it's dependencies in a less than obvious place and it is here you need to install d-tale. So having cloned the environment fire up the Windows command line and make sure you open it in Administrator mode:
- Type
cd C:\Users\xyz\AppData\Local\ESRI\conda\envs\YYY<SPAN class="line-numbers-rows"><SPAN></SPAN></SPAN>
where xyz is your user name and YYY is the cloned environment folder name
- Type
cd Scripts<SPAN class="line-numbers-rows"><SPAN></SPAN></SPAN>
- Finally in the Scripts folder, type
pip install --upgrade dtale<SPAN class="line-numbers-rows"><SPAN></SPAN></SPAN>
This will install d-tale into the cloned environment and will be accessible within ArcPro next time you open it.
So here is some sample code I then type into notebook in ArcPro, it takes a layer loaded in the map and creates a dataframe from 2 numeric fields, when you execute `d` a URL pops up and you click on it to see your data as a spreadsheet
<SPAN class="keyword token">import</SPAN> dtale
<SPAN class="keyword token">import</SPAN> pandas <SPAN class="keyword token">as</SPAN> pd
<SPAN class="keyword token">import</SPAN> arcpy
np <SPAN class="operator token">=</SPAN> arcpy<SPAN class="punctuation token">.</SPAN>da<SPAN class="punctuation token">.</SPAN>FeatureClassToNumPyArray<SPAN class="punctuation token">(</SPAN><SPAN class="string token">"EA_Sample_2020"</SPAN><SPAN class="punctuation token">,</SPAN><SPAN class="punctuation token">[</SPAN><SPAN class="string token">"LOC_NO"</SPAN><SPAN class="punctuation token">,</SPAN><SPAN class="string token">"Z020_LOC_T"</SPAN><SPAN class="punctuation token">]</SPAN><SPAN class="punctuation token">)</SPAN>
df <SPAN class="operator token">=</SPAN> pd<SPAN class="punctuation token">.</SPAN>DataFrame<SPAN class="punctuation token">(</SPAN>np<SPAN class="punctuation token">)</SPAN>
d <SPAN class="operator token">=</SPAN> dtale<SPAN class="punctuation token">.</SPAN>show<SPAN class="punctuation token">(</SPAN>df<SPAN class="punctuation token">)</SPAN>
d<SPAN class="line-numbers-rows"><SPAN></SPAN><SPAN></SPAN><SPAN></SPAN><SPAN></SPAN><SPAN></SPAN><SPAN></SPAN><SPAN></SPAN></SPAN>
So in the window I create a new field called acs and its the SUM of the previous two fields
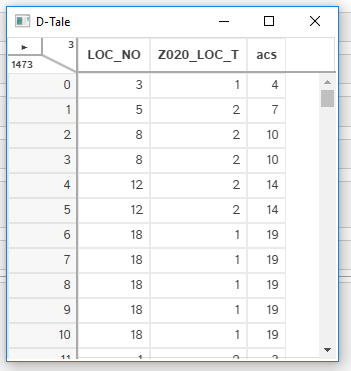
To get this new an improved data back into a pandas data frame you can type the following code into notebook then do something with it.
df2 <SPAN class="operator token">=</SPAN> d<SPAN class="punctuation token">.</SPAN>data<SPAN class="punctuation token">.</SPAN>copy<SPAN class="punctuation token">(</SPAN><SPAN class="punctuation token">)</SPAN>
df2<SPAN class="punctuation token">.</SPAN>head<SPAN class="punctuation token">(</SPAN><SPAN class="punctuation token">)</SPAN><SPAN class="line-numbers-rows"><SPAN></SPAN><SPAN></SPAN></SPAN>