A simple verbose demo again, so that I don't forget.
I updated it to conform to python 3.x... which will inevitably hit ArcMap.
The script is pretty self explanatory and no effort has been made to simplify it.
<SPAN class="string token">"""
CollectionsDemo.py
<SPAN>Author: </SPAN><A class="jive-link-email-small" href="mailto:Dan.Patterson@carleton.ca" rel="nofollow noopener noreferrer" target="_blank">Dan.Patterson@carleton.ca</A><SPAN> </SPAN>
Purpose:
To demonstrate the utility of using the collections module to
obtain a simple frequency distribution, in this case, a list
of random integers. It is written verbosely so that the user
can see the sequence of events and the results of the various
methods.
A sequence of random numbers is generated and a dictionary of
key:values is produced by collections.Counter. The resultant
keys are cloned to "classes" to prevent alteration of the
initial keys. An extra class is appended to the list to ensure
that the last class in the keys is included since the behaviour
of histogram is to combine the last two classes into
one frequency (long story). I just add a value of 1 to the last
class to produce an extra bin.
A histogram is produced which contains the classes and the frequency
for those classes.
"""</SPAN>
<SPAN class="keyword token">import</SPAN> collections
<SPAN class="keyword token">import</SPAN> random
<SPAN class="keyword token">import</SPAN> numpy <SPAN class="keyword token">as</SPAN> np
<SPAN class="keyword token">from</SPAN> matplotlib <SPAN class="keyword token">import</SPAN> pyplot <SPAN class="keyword token">as</SPAN> plt
rand_int <SPAN class="operator token">=</SPAN> <SPAN class="punctuation token">[</SPAN>random<SPAN class="punctuation token">.</SPAN>randrange<SPAN class="punctuation token">(</SPAN><SPAN class="number token">1</SPAN><SPAN class="punctuation token">,</SPAN><SPAN class="number token">6</SPAN><SPAN class="punctuation token">)</SPAN> <SPAN class="keyword token">for</SPAN> i <SPAN class="keyword token">in</SPAN> range<SPAN class="punctuation token">(</SPAN><SPAN class="number token">15</SPAN><SPAN class="punctuation token">)</SPAN><SPAN class="punctuation token">]</SPAN>
dict <SPAN class="operator token">=</SPAN> collections<SPAN class="punctuation token">.</SPAN>Counter<SPAN class="punctuation token">(</SPAN>rand_int<SPAN class="punctuation token">)</SPAN>
keys <SPAN class="operator token">=</SPAN> dict<SPAN class="punctuation token">.</SPAN>keys<SPAN class="punctuation token">(</SPAN><SPAN class="punctuation token">)</SPAN>
counts <SPAN class="operator token">=</SPAN> dict<SPAN class="punctuation token">.</SPAN>values<SPAN class="punctuation token">(</SPAN><SPAN class="punctuation token">)</SPAN>
classes <SPAN class="operator token">=</SPAN> list<SPAN class="punctuation token">(</SPAN>keys<SPAN class="punctuation token">)</SPAN> <SPAN class="comment token">#clone the keys </SPAN>
classes<SPAN class="punctuation token">.</SPAN>append<SPAN class="punctuation token">(</SPAN>classes<SPAN class="punctuation token">[</SPAN><SPAN class="operator token">-</SPAN><SPAN class="number token">1</SPAN><SPAN class="punctuation token">]</SPAN> <SPAN class="operator token">+</SPAN> <SPAN class="number token">1</SPAN><SPAN class="punctuation token">)</SPAN> <SPAN class="comment token">#to ensure that the last bin has values </SPAN>
<SPAN class="comment token"># </SPAN>
histo <SPAN class="operator token">=</SPAN> np<SPAN class="punctuation token">.</SPAN>histogram<SPAN class="punctuation token">(</SPAN>rand_int<SPAN class="punctuation token">,</SPAN>classes<SPAN class="punctuation token">)</SPAN>
<SPAN class="comment token">#</SPAN>
args <SPAN class="operator token">=</SPAN> <SPAN class="punctuation token">[</SPAN>rand_int<SPAN class="punctuation token">,</SPAN> dict<SPAN class="punctuation token">,</SPAN> keys<SPAN class="punctuation token">,</SPAN> counts<SPAN class="punctuation token">,</SPAN> histo<SPAN class="punctuation token">,</SPAN> histo<SPAN class="punctuation token">[</SPAN><SPAN class="number token">1</SPAN><SPAN class="punctuation token">]</SPAN><SPAN class="punctuation token">,</SPAN> histo<SPAN class="punctuation token">[</SPAN><SPAN class="number token">0</SPAN><SPAN class="punctuation token">]</SPAN><SPAN class="punctuation token">]</SPAN>
frmt <SPAN class="operator token">=</SPAN> <SPAN class="string token">"""
Collections and pylab
Random integers: {}
Collections dict:
{}
keys: {}
values (freq): {}
Histogram {}
classes: {}
frequency: {}
"""</SPAN>
<SPAN class="keyword token">print</SPAN><SPAN class="punctuation token">(</SPAN>frmt<SPAN class="punctuation token">.</SPAN>format<SPAN class="punctuation token">(</SPAN><SPAN class="operator token">*</SPAN>args<SPAN class="punctuation token">)</SPAN><SPAN class="punctuation token">)</SPAN>
<SPAN class="comment token">#</SPAN>
plt<SPAN class="punctuation token">.</SPAN>hist<SPAN class="punctuation token">(</SPAN>rand_int<SPAN class="punctuation token">,</SPAN>bins<SPAN class="operator token">=</SPAN>classes<SPAN class="punctuation token">,</SPAN>align<SPAN class="operator token">=</SPAN><SPAN class="string token">'left'</SPAN><SPAN class="punctuation token">)</SPAN>
plt<SPAN class="punctuation token">.</SPAN>title<SPAN class="punctuation token">(</SPAN><SPAN class="string token">"Sample Histogram"</SPAN><SPAN class="punctuation token">,</SPAN> loc<SPAN class="operator token">=</SPAN><SPAN class="string token">'center'</SPAN><SPAN class="punctuation token">)</SPAN>
plt<SPAN class="punctuation token">.</SPAN>xlabel<SPAN class="punctuation token">(</SPAN><SPAN class="string token">"class"</SPAN><SPAN class="punctuation token">)</SPAN><SPAN class="punctuation token">;</SPAN> plt<SPAN class="punctuation token">.</SPAN>ylabel<SPAN class="punctuation token">(</SPAN><SPAN class="string token">"frequency"</SPAN><SPAN class="punctuation token">)</SPAN>
plt<SPAN class="punctuation token">.</SPAN>show<SPAN class="punctuation token">(</SPAN><SPAN class="punctuation token">)</SPAN>
plt<SPAN class="punctuation token">.</SPAN>close<SPAN class="punctuation token">(</SPAN><SPAN class="punctuation token">)</SPAN><SPAN class="line-numbers-rows"><SPAN></SPAN><SPAN></SPAN><SPAN></SPAN><SPAN></SPAN><SPAN></SPAN><SPAN></SPAN><SPAN></SPAN><SPAN></SPAN><SPAN></SPAN><SPAN></SPAN><SPAN></SPAN><SPAN></SPAN><SPAN></SPAN><SPAN></SPAN><SPAN></SPAN><SPAN></SPAN><SPAN></SPAN><SPAN></SPAN><SPAN></SPAN><SPAN></SPAN><SPAN></SPAN><SPAN></SPAN><SPAN></SPAN><SPAN></SPAN><SPAN></SPAN><SPAN></SPAN><SPAN></SPAN><SPAN></SPAN><SPAN></SPAN><SPAN></SPAN><SPAN></SPAN><SPAN></SPAN><SPAN></SPAN><SPAN></SPAN><SPAN></SPAN><SPAN></SPAN><SPAN></SPAN><SPAN></SPAN><SPAN></SPAN><SPAN></SPAN><SPAN></SPAN><SPAN></SPAN><SPAN></SPAN><SPAN></SPAN><SPAN></SPAN><SPAN></SPAN><SPAN></SPAN><SPAN></SPAN><SPAN></SPAN><SPAN></SPAN><SPAN></SPAN><SPAN></SPAN><SPAN></SPAN><SPAN></SPAN></SPAN>Results
Collections and pylab
Random integers: [4, 5, 3, 4, 2, 4, 1, 5, 4, 5, 4, 5, 2, 2, 3]
Collections dict:
Counter({4: 5, 5: 4, 2: 3, 3: 2, 1: 1})
keys: dict_keys([1, 2, 3, 4, 5])
values (freq): dict_values([1, 3, 2, 5, 4])
Histogram (array([1, 3, 2, 5, 4]), array([1, 2, 3, 4, 5, 6]))
classes: [1 2 3 4 5 6]
frequency: [1 3 2 5 4] <SPAN class="line-numbers-rows"><SPAN></SPAN><SPAN></SPAN><SPAN></SPAN><SPAN></SPAN><SPAN></SPAN><SPAN></SPAN><SPAN></SPAN><SPAN></SPAN><SPAN></SPAN></SPAN>As a simple histogram.
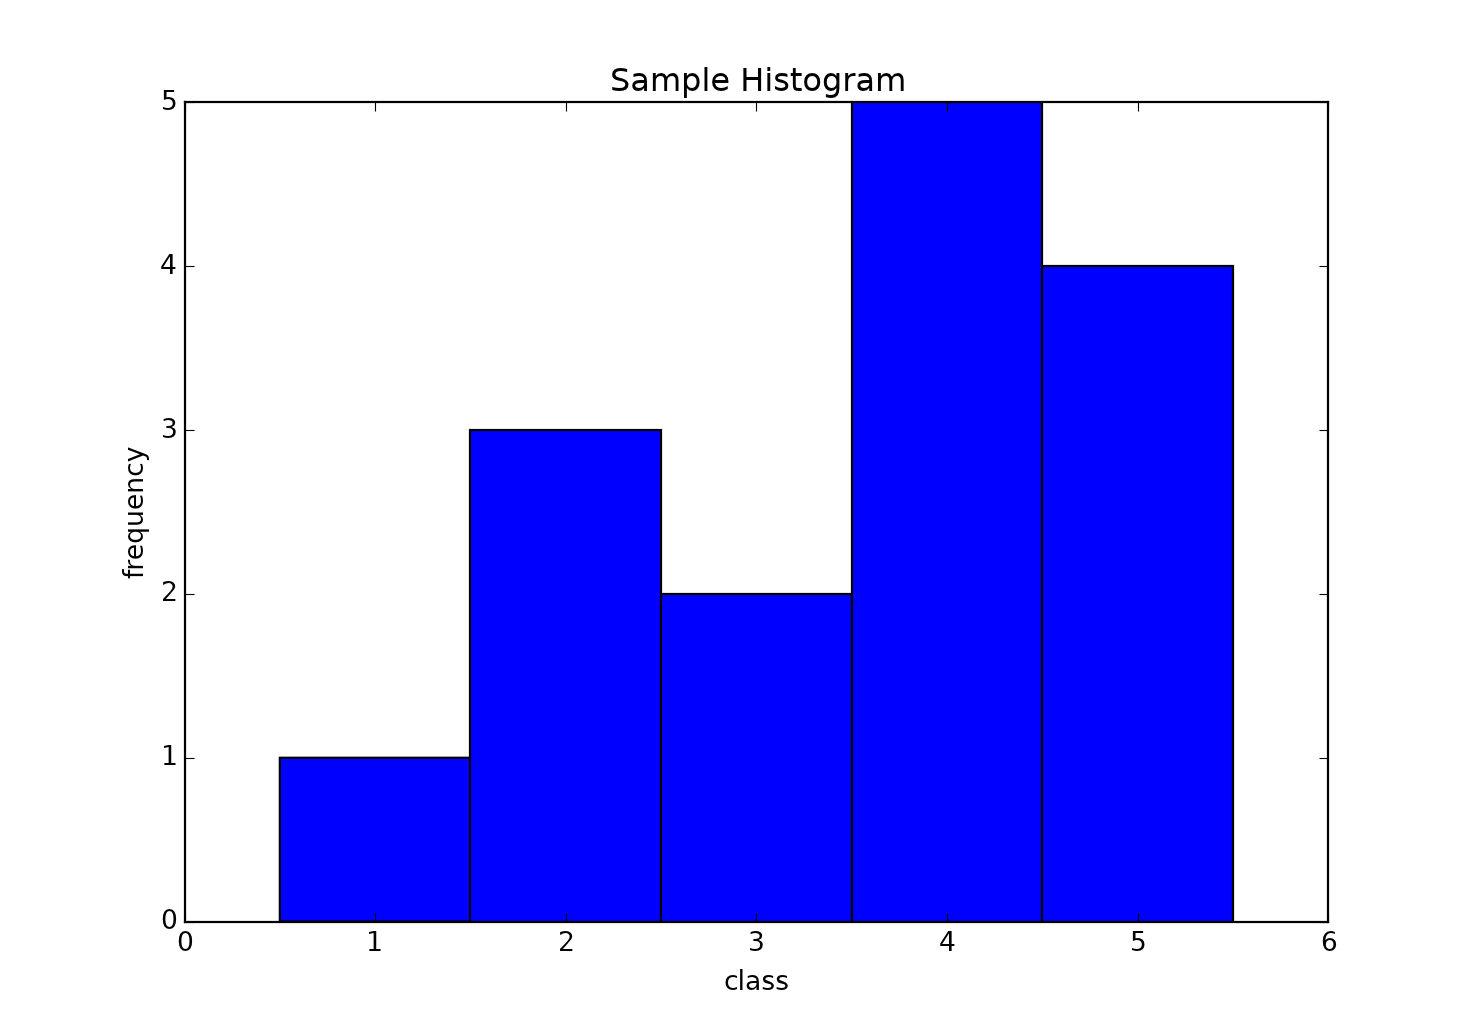
Which of course can be fancied up to suit your needs. Matplotlib is certainly one package to explore... and there are even high-end graphics modules.
