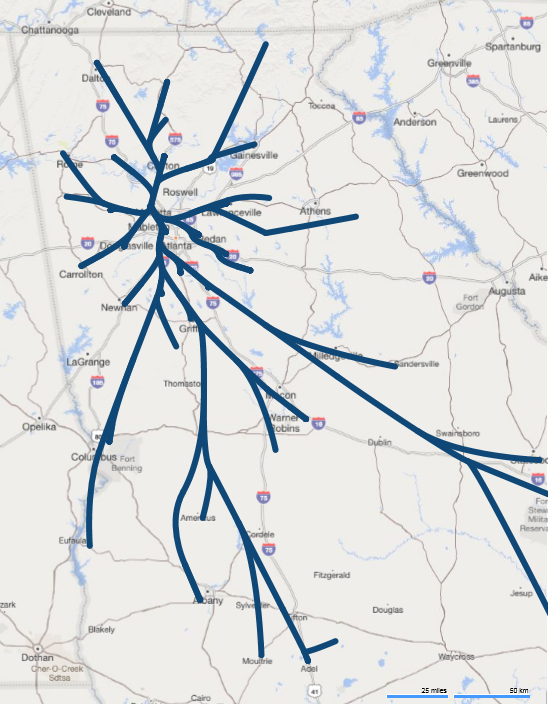
Hi. The infographic in Business Analyst (online) has been working well for us but we manually add a flow graphic to the pdf export to tell part of our story. It would be helpful if we could include a flow graphic as one of the infographic widgets. Is this possible? I believe this kind of graphic is available in ArcGIS Pro. Attached is an example we are producing now in PowerBI. The graphic shows a starting geo-location and ending geo-location and maps the number of flow instances with line thickness.