I'm so sorry if this has been asked, and I'm extra sorry if this is an easy fix. I'd like to be able to put a table in my survey. This is what my datasheet looks like:
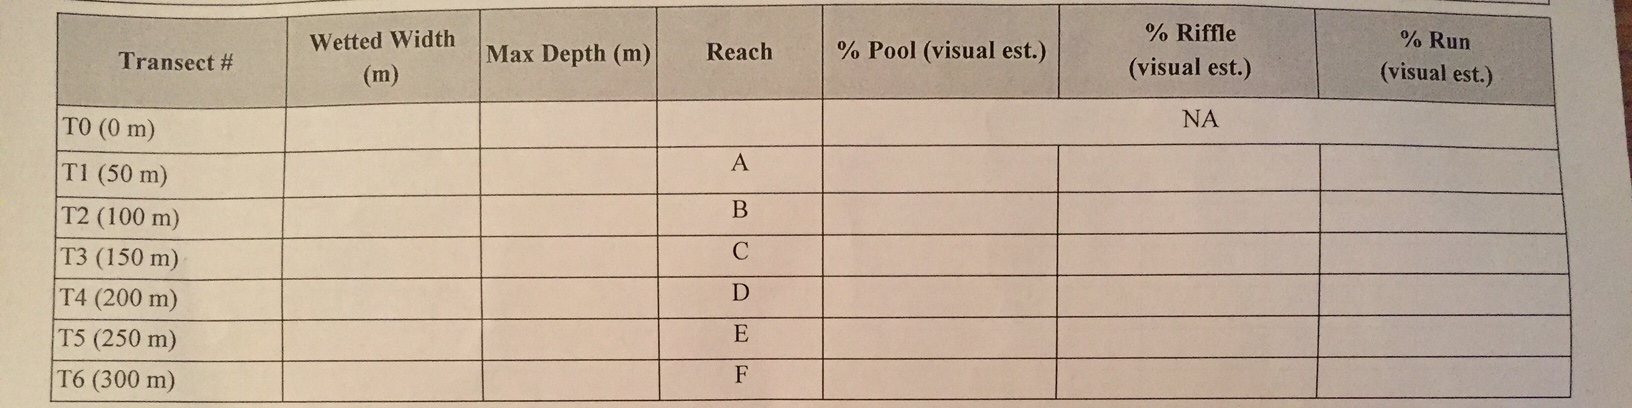
This is for taking stream data. I know I could put a new group for each transect, but is there an easier way to set up my survey to make is visually easier to input data?
Thanks!


