Hi all,
I would like to get a sense of where Insights for ArcGIS is going and where the community would like it to go.
I like insights, its drag and drop functionality was very easy to learn and the tight integration with my spatial data is a welcome feature coming form other data science visualization software.
However, it is lacking in fine control, at least from my experience so far.
Here is an example:
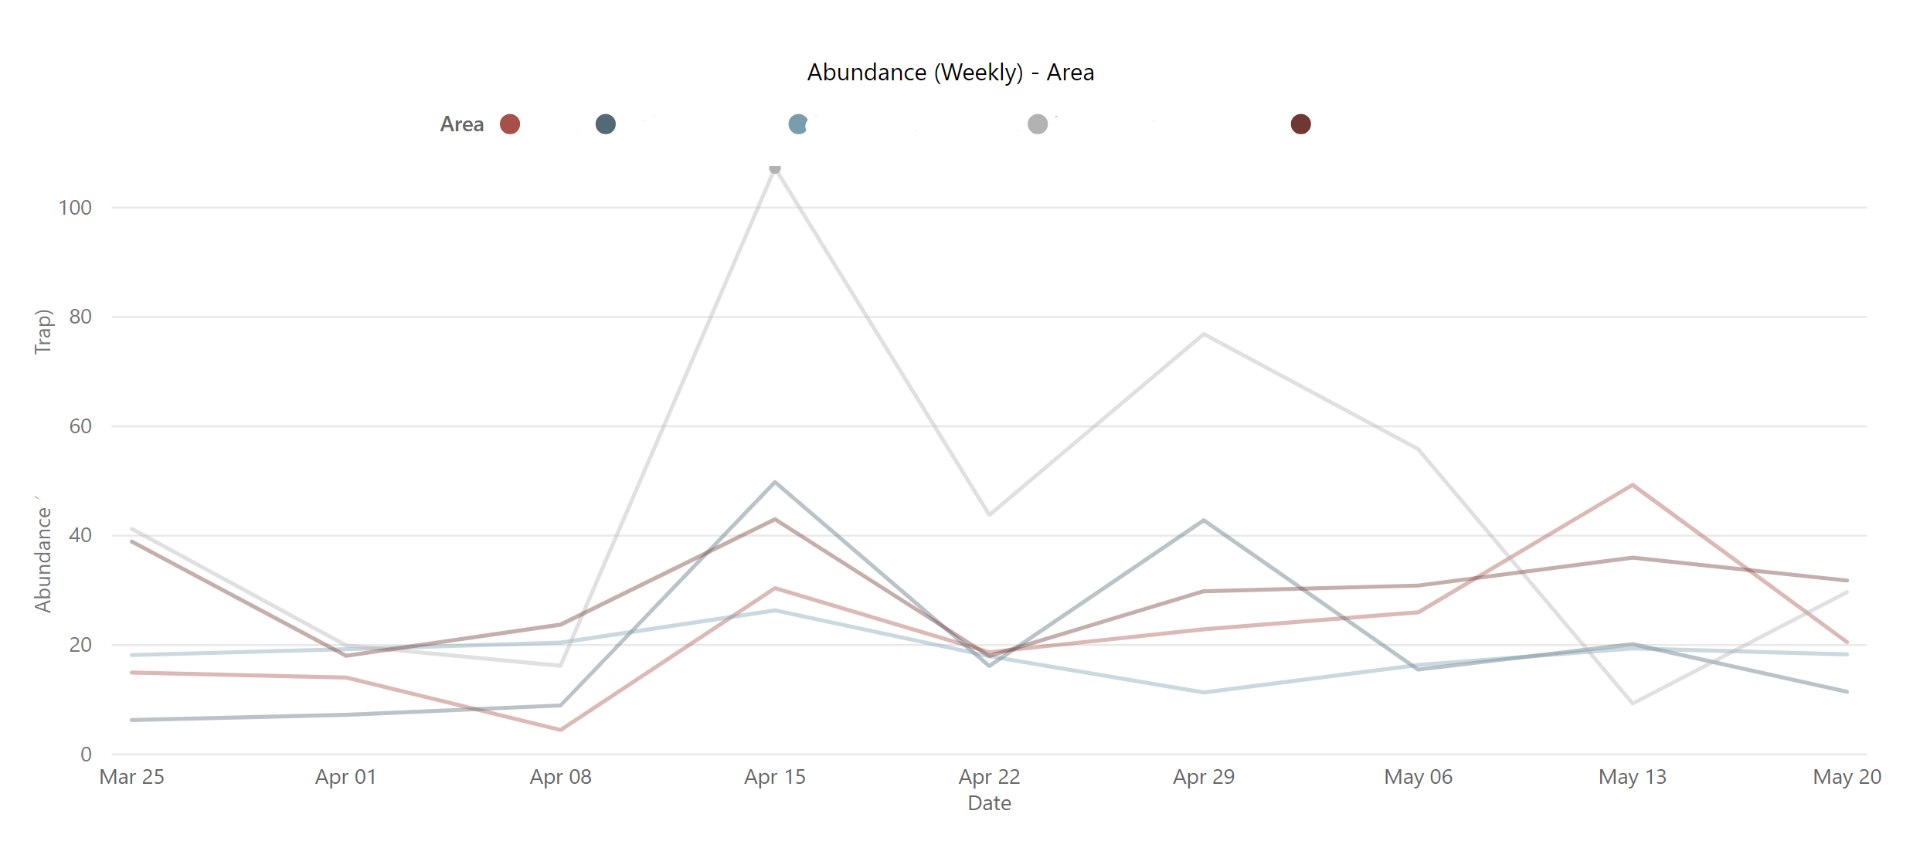
This is a report that I created in Power BI--
This is the closest I could come in Insights--
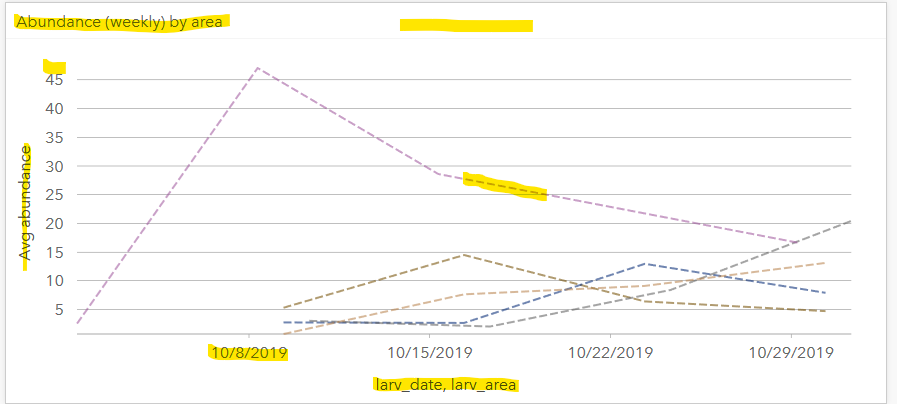
I can't place or format the title.
I can't change the axis labels
I can't customize the Y axis (i.e. set a maximum scale)
I can't customize the time labels
I can't change the line style (I think normally you can but with this time series it was stuck as dashed lines)
I can't add a persistent legend (there is a pop out legend but the chart can't stand alone without a visible legend)
In addition most of my data are time based but there is no interactive time slider for maps or charts (that I could see).
What is the plan for Insights? Will this fine control eventually be implemented?
Do other people in the community think these are desirable functions?



