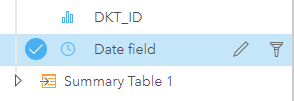
I am working on date fields in Insight app. As I have read on the Esri help websites that Insights will automatically divide date/time fields into parts that can be used as string fields in other visualizations, such as Year, Month, Day of a week, or Hour. But my own date field was not working like that. If there are no subfields divided, it's hard to create the column/bar charts except time series charts. You can find the detail in the following screenshot:
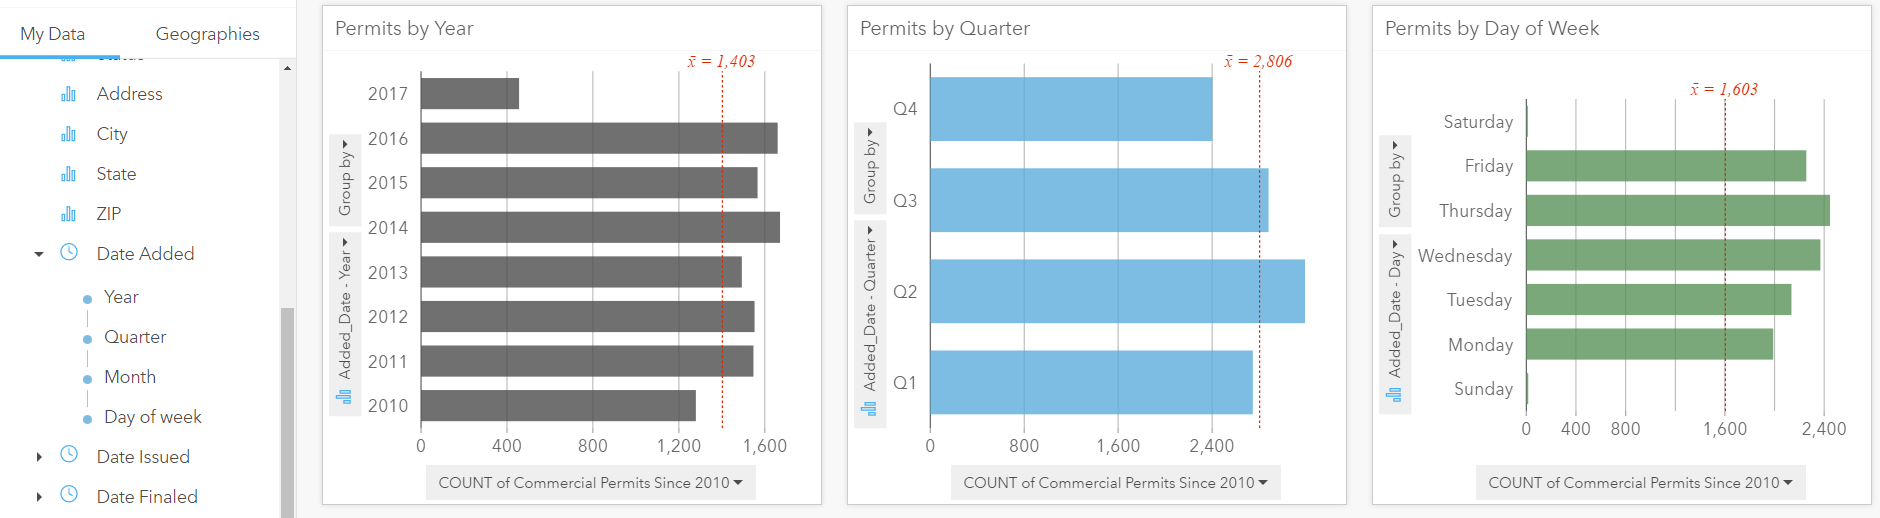
I would like to create some charts as below:
Any solution to this problem?
Thank you very much, guys!
Thao Nguyen

