Hi All,
I have been doing some googling and am yet to find what I am looking for, basically because I dont know what im trying to do is called.
I have a data driven map set, it is based on a polygon feature class called 'Data Driven Grid'. This grid has an attribute called 'classification' (AKA the location), and I have a py script which iterates through these locations and exports a single PDF... here is my current py:
import os, arcpy
mxd = arcpy.mapping.MapDocument("CURRENT")
#Create final output PDF file
finalFile = r"C:\temp\BensMap.pdf"
if os.path.isfile(finalFile):
  os.remove(finalFile)
  print 'Removed existing output file'
mxd.dataDrivenPages.exportToPDF(finalFile, page_range_type="ALL", image_compression="DEFLATE")
del mxd
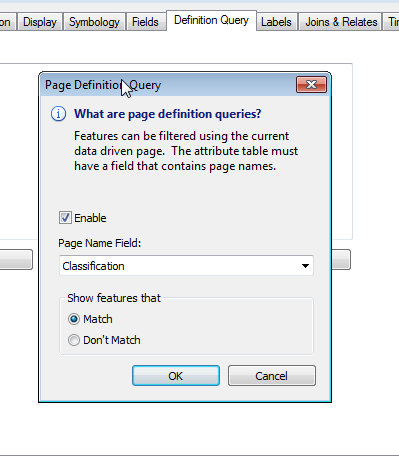
print 'complete'So I have a second point feature class (called 'sampling sites') displaying points that have a matching location, so these are basically 'data driven'. This works well, it only shows the points that match the page that is being plotted.
What I would like to so is similar to a report, I want a table to be placed on my page, and the table shows the sample site number, and associated attributes.
I am happy for the table to be fixed number of rows, my data only varies from 7-10 attributes each time, so a few blank rows won't hurt.
Can anyone tell me if there is a name for what I am trying to do? I have no idea if this is possible as i am not trying to return attributes from my data driven page feature class, but another feature class all together.
Cheers


