Hello,
I encountered a curious issue while trying to automate the creation of a series of graphs using Python that include inserting non-ASCII characters.
The problem is that if I run the script as a tool from ArcMap, I don't get the non-ASCII characters inserted, but if I run the script separately, outside of ArcMap, the output is correct.
I have an example using the script from matplotlib documentation:
text_labels_and_annotations example code: unicode_demo.py — Matplotlib 2.0.2 documentation
Example script (modified to save the graph):
# -*- coding: utf-8 -*-
"""
Demo of unicode support in text and labels.
"""
from __future__ import unicode_literals
import matplotlib.pyplot as plt
import tempfile
import os
plt.title('Développés et fabriqués')
plt.xlabel("réactivité nous permettent d'être sélectionnés et adoptés")
plt.ylabel('André was here!')
plt.text(0.2, 0.8, 'Institut für Festkörperphysik', rotation=45)
plt.text(0.4, 0.2, 'AVA (check kerning)
plt.savefig(os.path.join(tempfile.gettempdir(), 'Sample_Graph.png'))
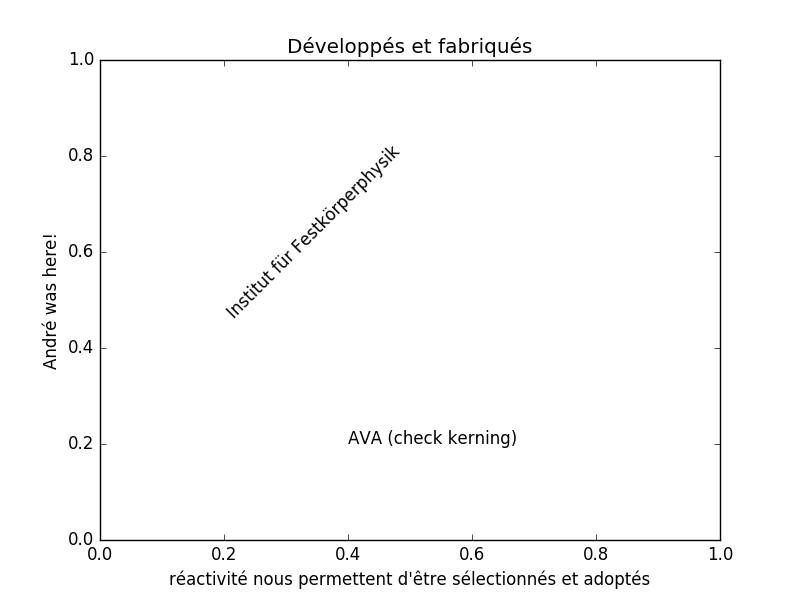
Graph result from running outside ArcMap:
Graph result from running the script as a tool in ArcMap:
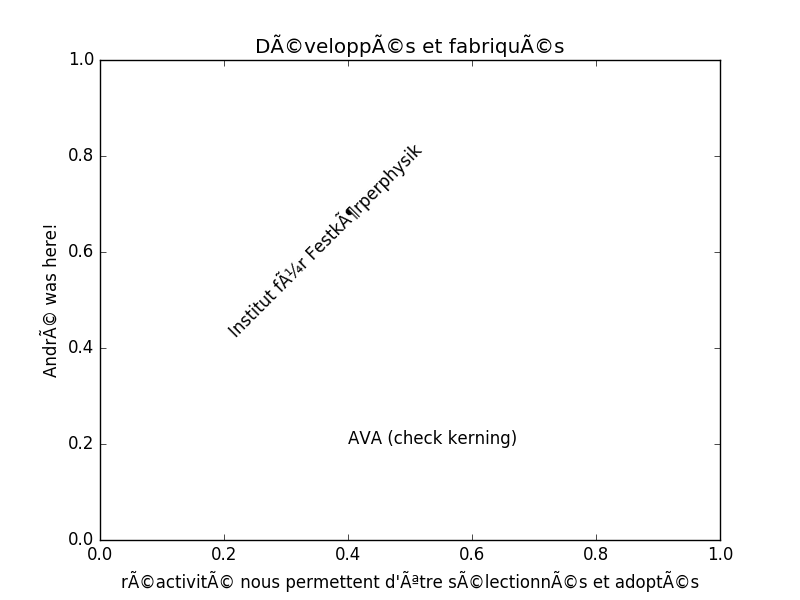
When running the same script from ArcMap as a tool, I don't get the non-ASCII characters printed in the graph. Has anyone else had this issue? Is this normal?
Thanks for any help! 
Alin

