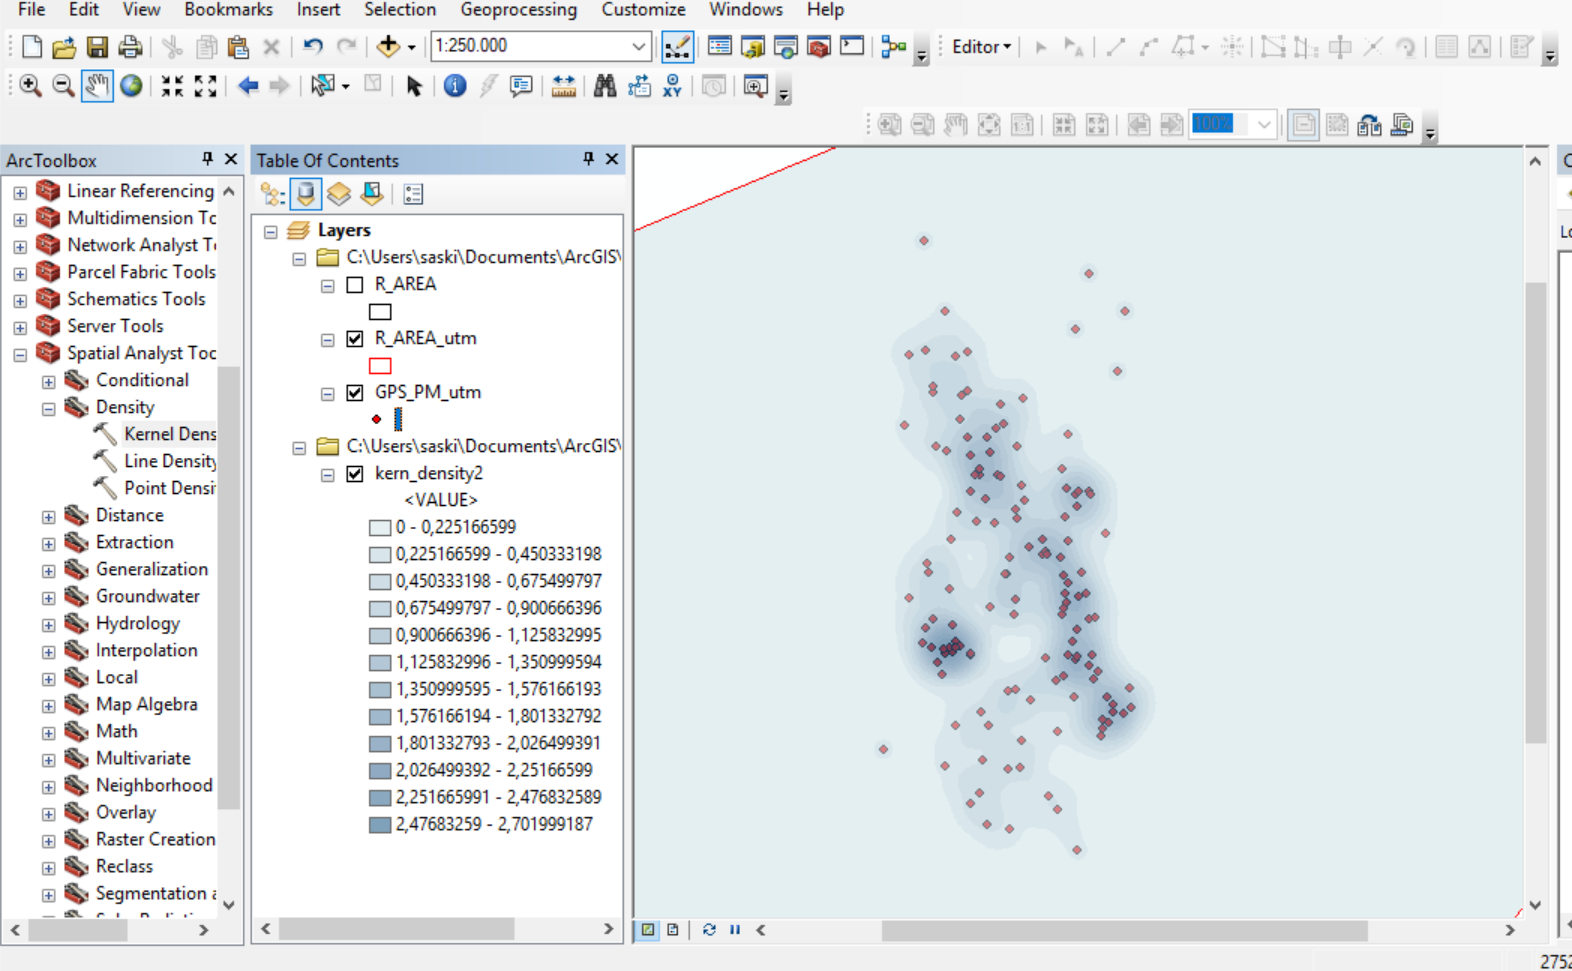
I am trying to display the coordinates I collected of sperm whales I found during my research in Northern Norway, using the kernel tool to show the density within the area. General info: total amount of whales found 141, so 141 different coordinates, output cell size is 50 and area units default, so square kilometers.
The values I get from the kernel density are now between 0 - 2.7. Does that mean a maximum of 2.7 sperm whales per km² were found (so the highest aggregation on the map)? When I zoom in closer to the area where most whales were found, so between 2.4 - 2.7 according to the values, I count 5 individuals?
I read through earlier posts and other websites but couldn't find the answer I am looking for.
Thanks,
Saskia