Good day everybody,
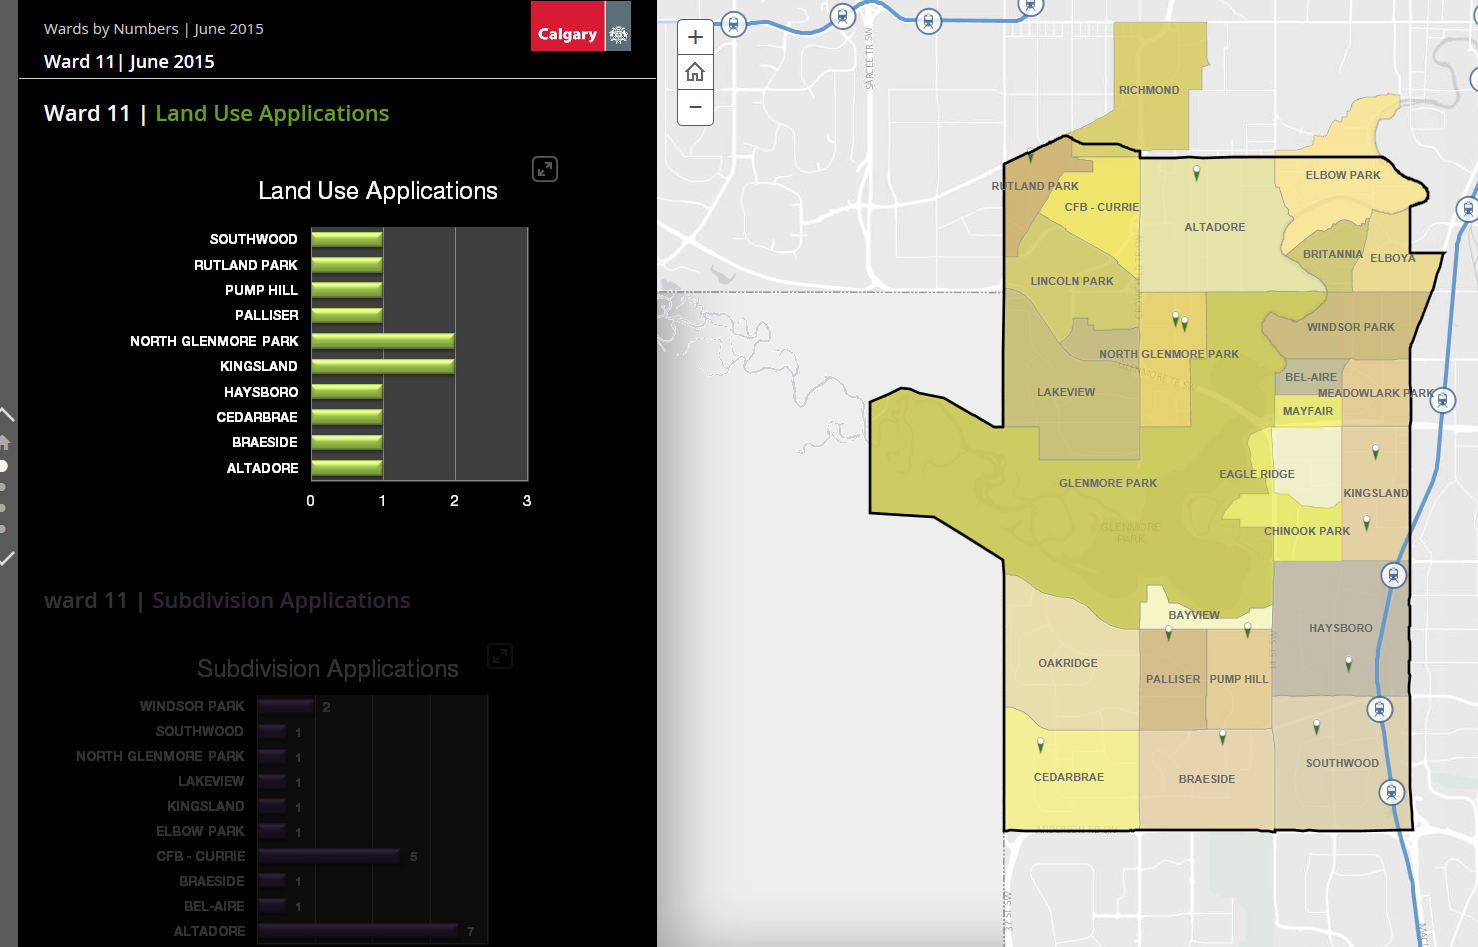
We have the following map which was created in AGOL using the "Story Map Journal" template. As you scroll through the chart data on the left, the data on the map changes to reflect the chart that is displayed. This works fine but is very manually intensive. There are approximately 90 charts which are all image files that are manually created and linked to, to display in the app.
I am wondering if it is possible to have the charts created on the fly in the same way that the map display changes dynamically. Not sure if this is the proper forum for this question but thought I'd start here.
Appreciate any ideas.
Thanks!