I'm trying to render an ImageryLayer by assigning it a Renderer to stylize it. I'm using a RasterStretchRenderer but it is not behaving as I would expect. Here is a CodePen sample of what I've got set up.
I expected that if I changed the statistics ```min``` or ```max``` values in my codePen the colors would change as per below from ArcMap:
Set to 0 - 3000
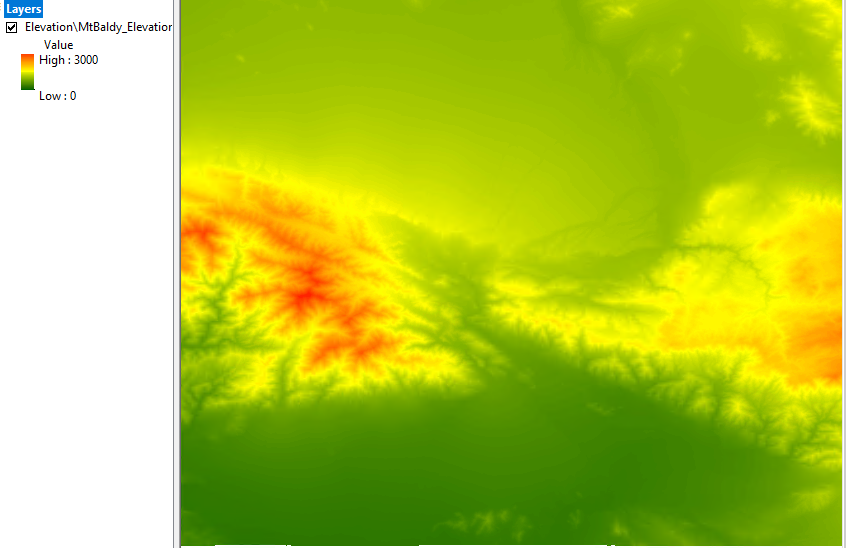
Now change the max to 2000:
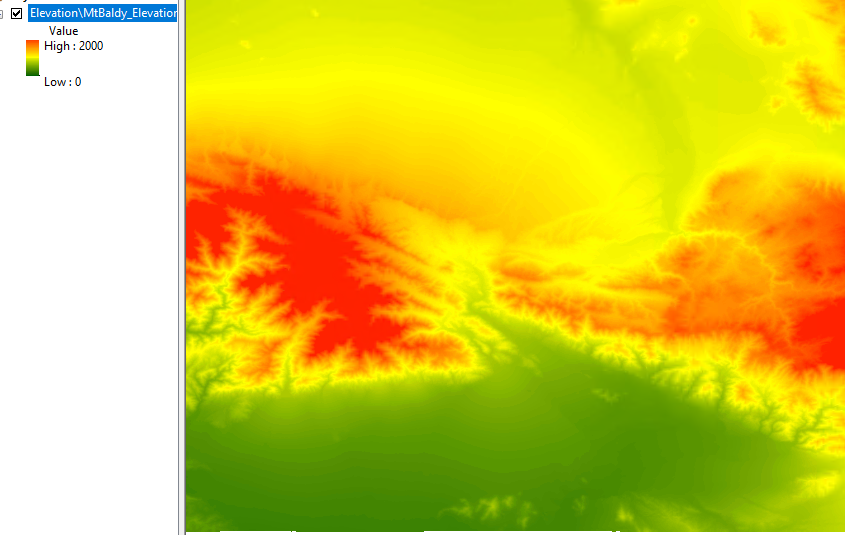
I want my example to behave akin to this ESRI JS Sample when you adjust the slider on the "min-max" stretch type for a TileImageryLayer.
The statistics properties I'm setting have no effect. The stretch is always based on the min, max values of the data itself. I'm thinking the problem has something to do with me not understanding how to set that up. I've also looked at the OutputMin, OutputMax values, and can't understand what they are doing. Changing the latter has similar effects to above but the numbers are all wrong.
Any advice, thoughts is welcome.