I'm trying to setup image services from 32 bit floating point single band rasters values 0-100. The goal is to display the rasters with the same Classified Defined Interval renderer used in the original .mxd with interval set to 20 = 5 classes, 0-20,20-40 and so on, like this:
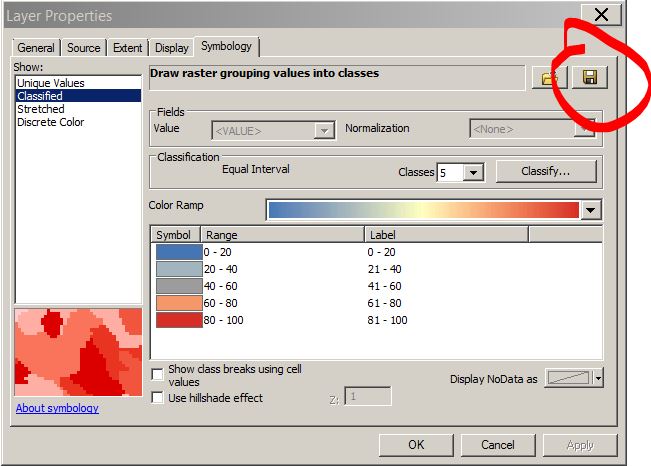
I save the Symbology as the Raster Function Template to .rft.xml file. I apply the raster function to the published image service referencing the same data from the .mxd.
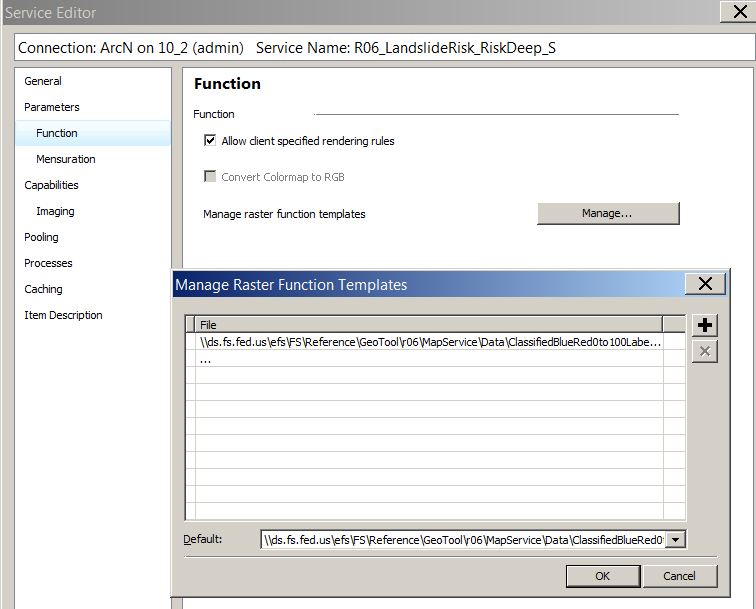
Here's the problem:
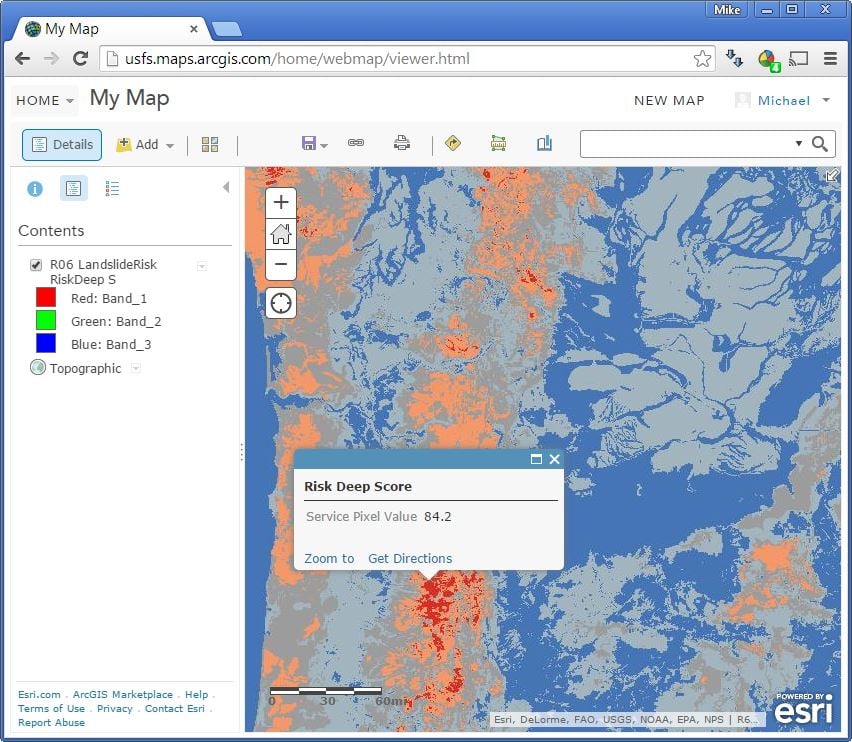
It properly renders the pixels with the classified range and colors. This also allows users to click the service in AGOL and get a popup of the original value (needed requirement and main reason to not use cached map service). However, the legend display just shows RGB, Band 1,2,3. This doesn't help the users when viewing the data. The project sponsors identified this as a problem and again requested popups with correct legend display. See here:
My plea for help!
- Is there a way to create/enable the raster function to output the legend for proper display? I tried using the Colormap function (first applying the Local function with Math > Int function), but this outputs a legend with 255 values for each distinct color value, not the original raster values 0-100, and not split into the 5 class ranges.
-OR-
- IS there a way to combine a tile layer with the correct popup information? I tried creating a hosted tile layer (can also create an AGS cache map service, but this was faster for now), which will improve performance and output correct legend. I found the option to enable a popup for a tile layer and specify a service URL as the popup info, but it did not take the image service. Boo..
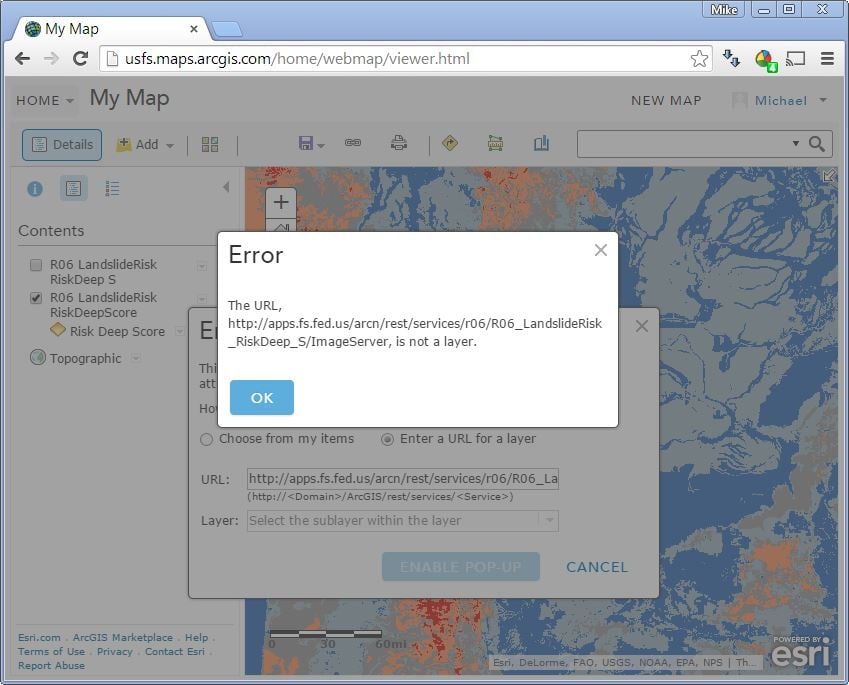
Lastly, I tried creating a Dynamic map service from the same data. Results = Correct legend BUT NO POPUP.....therefore can't combine that with the tile layer either.
Thanks for looking and hope you can help. Oh did I mention project milestone due by Monday and have been working all week (and now the weekend...) on this?,..! cheers, Mike


