Hi, I need to show some stacked/bar chart on a map based on some criteria, as shown here:
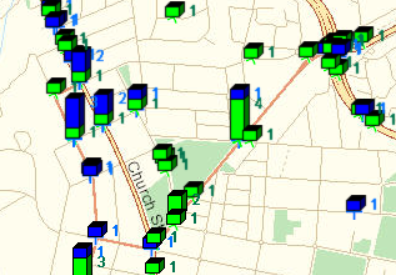
The bar height is the number of overlapping points in the same location. The blue and green colours basically means the type of the overlapping points.
Is there a way to achieve this, whether it's using out-of-box ArcGIS API for JavaScript functionality or some 3rd party library? I haven't been able to find anything.
The sample screenshot shows 3D bars but for now 2D bars can also work.
I am using ArcGIS API for JavaScript 3.22.
