Hi folks,
right now we are evaluating Esri-capabilities to display maritime charts (ENC-files). Thanks to Antti we've been able to display ENC-files in our application. However, when we compare the results with the Seven C's SeeMyENC application, they look quite different - although they use both the S52 standard for visualization. I've enclosed a picture to demonstrate the difference:
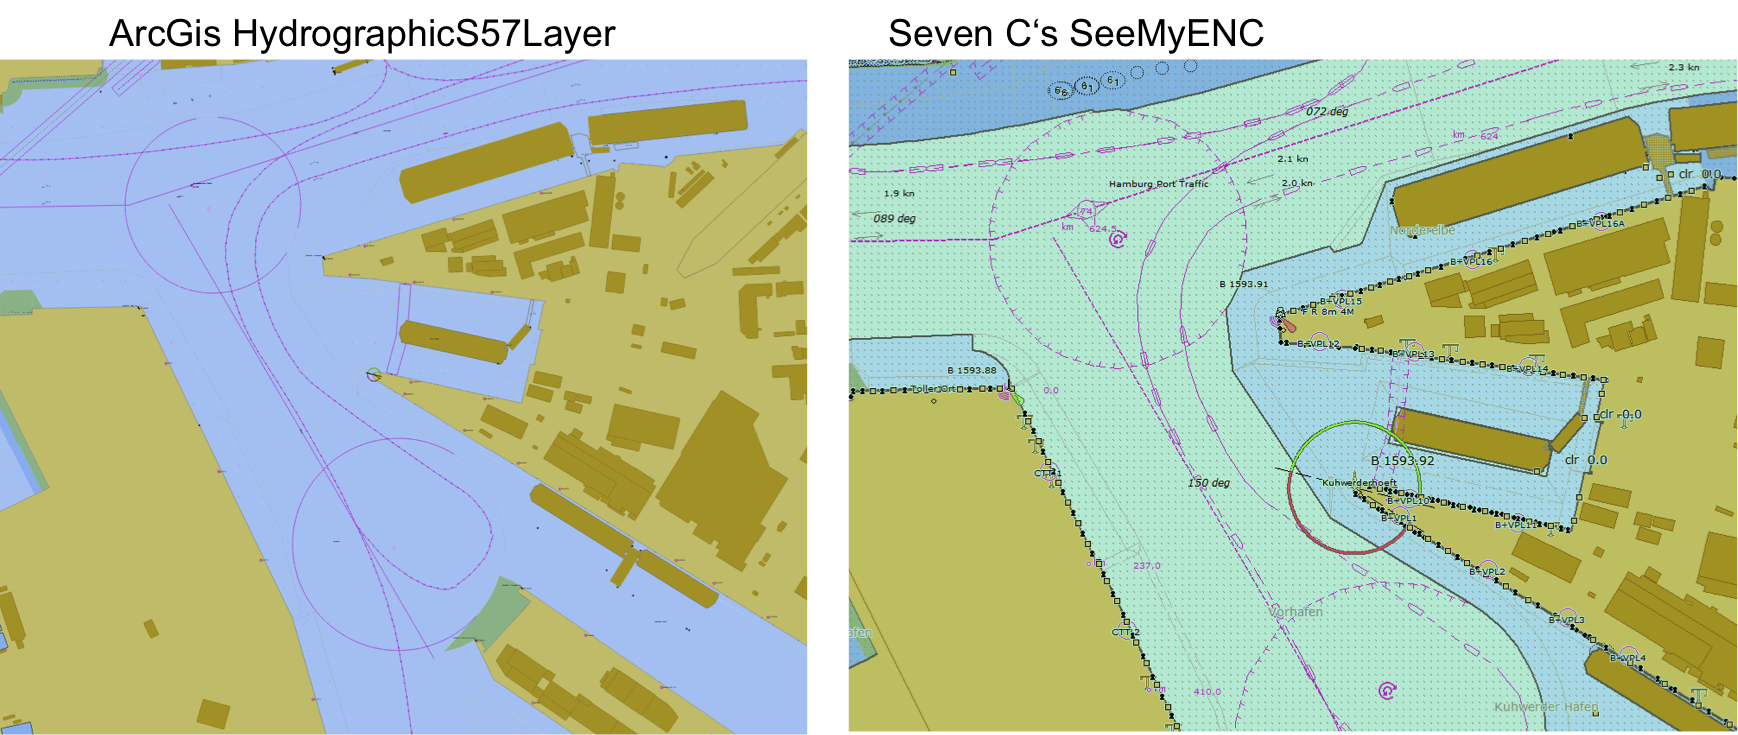
The HydrographicS57Layer does not display many symbols, text, numbers etc., not before we zoom in to a detailed map scale. Can we adjust some settings at what map scale symbols, text and numbers are displayed and how they are displayed (say font size and color)?
Kind regards,
Eugen

