By Tom Coolidge and Tom DeWitte
Gas utilities and pipelines are accelerating their implementation of real-time GIS capabilities as they transition to a net-zero world—for good reasons. Decision-makers and activity planners today need to account for many moving parts in their analyses and actions.
While the exact path forward to a net zero world remains to be determined and may vary from organization to organization, the general outline of the world ahead for all is increasingly foreseeable. Decision-makers and activity planners in the future will need to account for even more moving parts in their analyses and actions. And they likely will need to do all that in an operating paradigm different from that of today’s geologic natural gas era. In a nutshell, evolving gas utilities and pipelines today need to handle a high volume of changing data; tomorrow, they will need to handle even more, and that more will be less predictable and occur more rapidly.
Changing data is not new to gas utilities and pipelines. While some pipe network assets are at a fixed location, gas utilities and pipelines are not static businesses. They are very much alive. Changes are always occurring, sometimes rapidly. This is the case in their pipe networks, the surroundings through which they pass, and their workforce. For instance:
- Customer demand varies by temperature, day, time, activity, etc.
- Gas pressure, flow rate, and other variables can change in all or parts of the pipe network
- Flow control devices and other operating equipment can be in different states
- Trucks and crews move throughout the service territory
- Operating equipment is inspected and maintained
- Leaks occur and are repaired
- Sales and marketing staff meet with customers and prospects
- Weather conditions are always changing. Severe weather occurs occasionally; Natural disasters occur rarely
- Events and activities happen 24x7 throughout the service territory
- Customers and others post about their utility or pipeline on social media
Looking ahead, however they get there, gas utilities and pipelines in a net-zero world will operate differently and have more moving parts than they do today. Production will decentralize as renewable natural gas and hydrogen plants pop up throughout service territories. Production and consumption will be in closer proximity. Some production plants will interconnect with pipelines before the traditional city gate. Others may interconnect inside the traditional city gate. The supply mix and variability will increase. Supply may be intermittent. The demand mix and variability will increase. Resilient microgrids will rely on renewable natural gas when electric systems go down. All this will necessitate a higher level of operational agility.
Real-time data streams from sensors, devices, and feeds enable operational agility at an enterprise level by better addressing common user workflows that rely upon access to the latest information. Gas utilities and pipelines are increasingly relying on sensors to detect and measure change as it occurs to keep current with the state of assets, resources, and conditions.
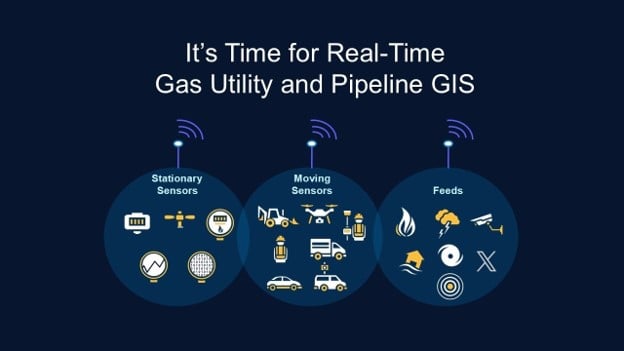
Sensors can be classified into three categories.
Some sensors are placed on stationary assets. Examples include smart meters that measure consumption and other variables at customer sites. Sensors on the pipe network measure the changing pressure, flow, temperature, gas composition, and other variables of the flowing gas. Yet other sensors remotely monitor the performance of cathodic protection systems. Still other sensors indicate the state of flow control devices and other operating equipment. Sensors also can be placed in areas prone to flooding to detect water as soon as it arrives.
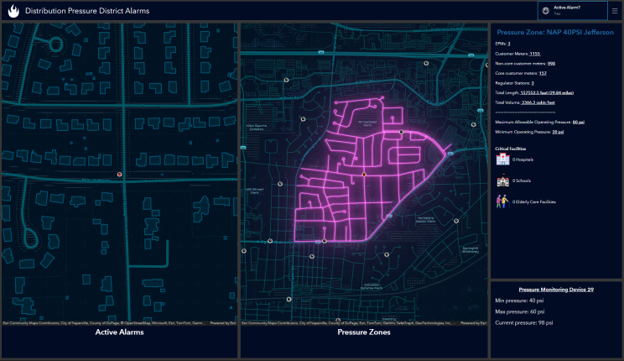
This dashboard shows the location of Pressure Monitoring Device 29 and the pressure zone affected by its pressure being higher than the maximum allowable pressure.
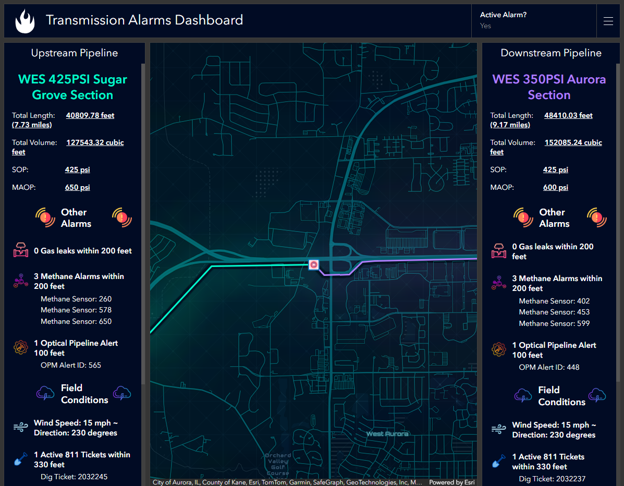
This dashboard shows the real-time aggregation of sensors in proximity to pipelines upstream and downstream of a compressor station that has triggered an alarm.
Other sensors are placed on moving objects, including trucks and other vehicles operating within the service territory. Sensors are also integrated into devices used by field crews during inspections and maintenance. Drones now provide gas utility and pipeline personnel with an option to “see” things just as if they were there.
The third category is feeds. Feeds are streams of data from sensor networks that update as new data becomes available. They bring the latest about traffic, severe weather, activity, boundary movement of natural disasters such as floods and wildfires, and social media mentions.
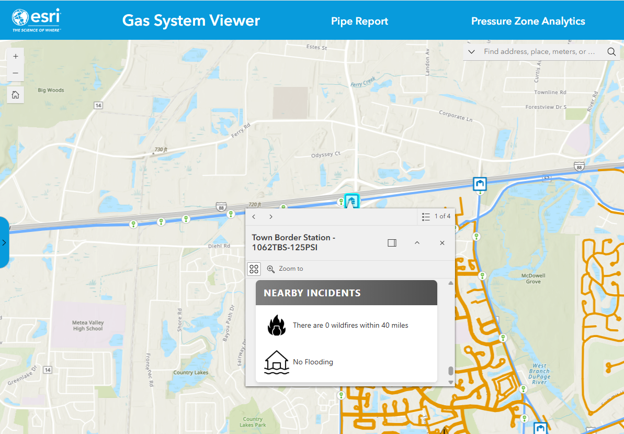
Data about changes within your utility or pipeline organization can realize its full potential only when location is an included attribute. Location, location, location is not only a mantra commonly associated with real estate; it’s also the key to gas utilities and pipelines discovering the intelligence they need for improved situational awareness and operational excellence. Real-time GIS adds the dimension of time to the traditional GIS dimension of space. By connecting location and time, real-time GIS puts the “now” in knowledge.
It is important to remember that once data is populated in a modern GIS database, it is immediately available to all GIS applications. And there are many applications for users in the office and in the field to choose from, tailored to what they need to do. One popular way to visualize real-time data is in dashboards. Good dashboards provide a comprehensive and engaging view of your data for at-a-glance decision-making and activity planning.
Dashboards use elements such as maps, lists, charts, gauges, and indicators to reflect the status and performance of people, services, assets, and events in real time. From a dynamic dashboard that updates continually as new data becomes available, you can view on one screen the activities and key performance indicators you need to know. This ideally equips decision-makers and activity planners with at-a-glance access to the complete, up-to-date information they need.
Of course, dashboards are only one way of sharing real-time maps and location information. There are many others. Real-time maps of all forms can be shared on any device, anytime, anywhere.
Time will refine just how gas utilities and pipelines evolve from how they operate today to how they need to operate in a net zero world. But ArcGIS today contains the real-time capabilities you need to kick-start development of your real-time GIS or further advance one you already have. For sure, real-time GIS is a key enabler of gas utilities and pipelines at an enterprise level committed to achieving the operational agility essential to success in the net zero world ahead.
PLEASE NOTE: The postings on this site are our own and don't necessarily represent Esri's position, strategies, or opinions.
