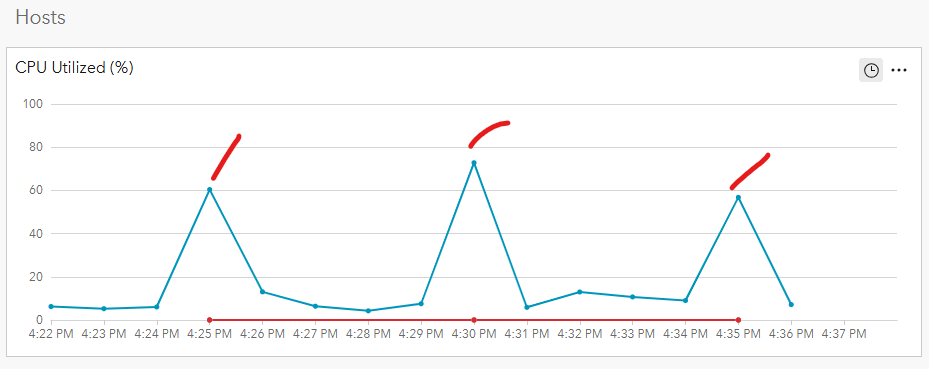
We recently ran into a pretty serious configuration flaw with observer scheduling that affects system utilization metrics (in particular CPU Utilization %). Incorrectly showing CPU at 70%-100% utilization at all times.
System Utilization Metrics are gathered from the 'Metrics - Host Windows' observer.
When multiple observers run, it causes a brief significant utilization spike. This utilization matches what is shown in performance monitor within the monitored server. To minimize utilization bias from the other observers, 'Metrics - Host Windows' should never run alongside other observers. The current interval settings make this impossible.
Recommendation: add an option to where we can stagger the observer run times. Example, start running at "00:00:30" (30 seconds past midnight) with a repeat interval of 1 minute. This would perfectly fix this problem!
Below screenshot is example of 'Metrics - Host Windows' set to run every 1 minute and other observers set to run every 5 minutes. You can clearly see the brief CPU spike because of the observers. True CPU usage is ~5%. The 70% spike is because this observer runs the exact same time as other observers. Being able to schedule this to occur at non-exact-minute times would fix this issue.