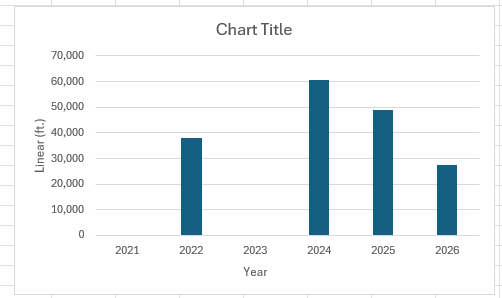
Hello! I am new at doing dashboard for ArcGIS Online. I tried to create a serial chart, and it looks weird. I am trying to get the serial chart to look like the one in Excel. Does anyone have a tip on how to get it to look like this and what is the correct type for data field for hosted feature for year and linear ft? Thanks in advance!