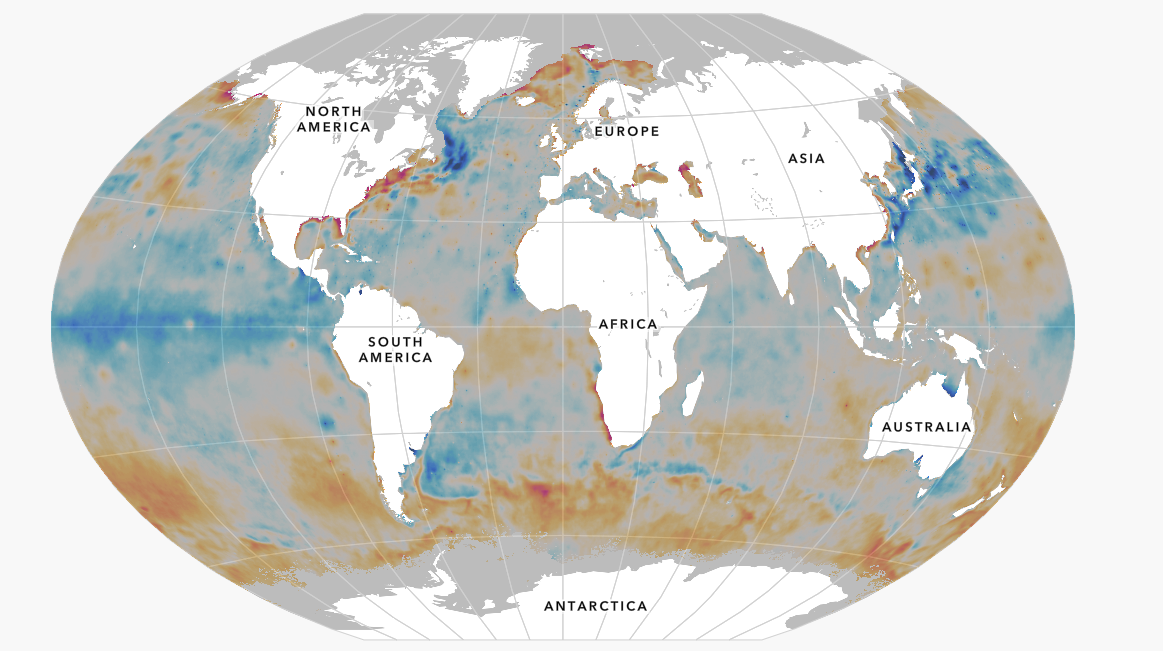
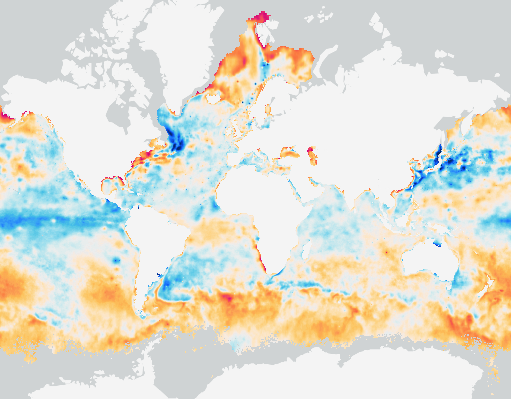
I am trying out some basemaps published by one of the Esri team - they use alternative map projections. Example - Winkel Tripel (They are added to a basemaps group for our organisation)
They seem to display over the data, rather than under. Why is this, and can I change it?
(first image, Sea Surface Temperature Anomaly over Winkel Tripel basemap, second is same data over Light Grey Canvas)