Would Esri be open to renaming “Confidence” to “Confident Interval” or “Confidence Int.” for OHSA results?
I realize this could be rectified quickly by the user by simply renaming it within the "Contents" pane. However, I think it's important Esri considers the potential misinterpretation of the OHSA results by designating "Confidence" alongside hot/cold spots (see first image below). We certainly want to report Confidence Intervals (CI) alongside any designated hot or cold spots since we are using a statistical test with hypotheses. However, use of “Confidence” as the default output designated in the Contents pane (and shown in the below graphic) could result in user statements like “…we demonstrate 90%, 95%, and/or 99% Confidence that a hot/cold spot exists...”. That’s not entirely true. Adding “Interval” or “Int.” could avoid this misinterpretation and lead to more accurate statements like:
- “We demonstrate statistically significant hot/cold spot(s) (90, 95, 99% Confidence Intervals)…” or
- “The project contains statistically significant hot/cold spots with 90, 95, 99% Confidence Intervals”
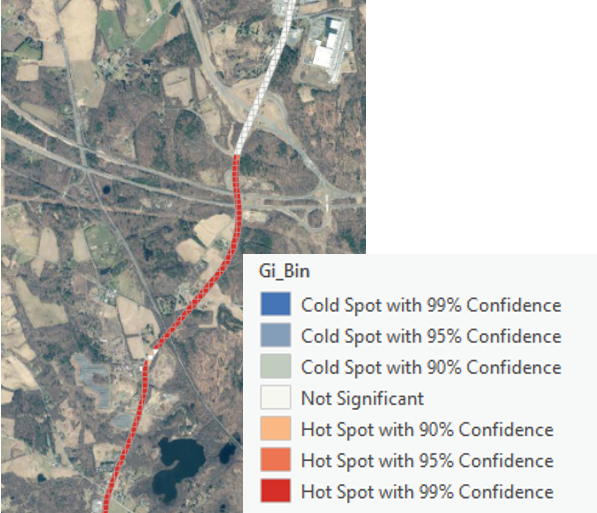
It’s a minor suggestion but it’s actually really important statistical vernacular since Confidence Intervals indicate the level of error we are willing to accept for rejecting the Null Hypothesis. In the case of OHSA, it’s a two-tailed test via the following hypotheses:
Null Hypothesis (HO): Points adhere to Complete Spatial Randomness.
Alternate Hypothesis (HA): Points are not randomly distributed, the exhibit spatial patterning – clustering (hot spot) or dispersion (cold spot).
If we have a statistically significant hot/cold spot with a 90% CI, we are admitting there is a 10% chance that we reject the Null Hypothesis when it is true (Type I error). See error information below.
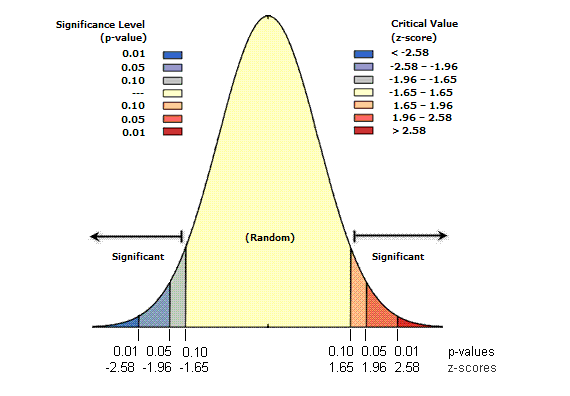
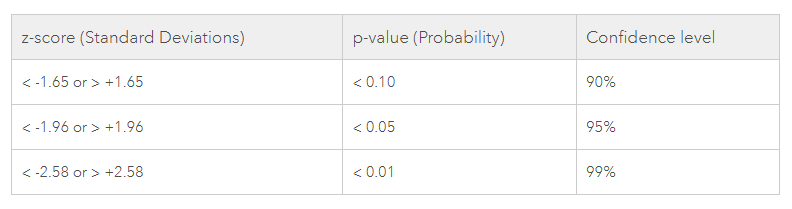
Our p-value provides the probability that the observed result was created by some random process. A small p-value means it is very unlikely that our observed spatial pattern was derived from a random occurrence. We use both the p-value and the Test Statistic (z-score) as inputs to decide whether to accept/reject the Null Hypothesis (above) and at what level of acceptable error via CI. See the graphic directly from ESRI below for p-values and z-scores and the table that relates them to CIs.
In statistics there are two types of errors:
Type I – False positive – you reject the null hypothesis when you shouldn’t have (it’s true).
- Related to the probability alpha (α)
Type II – False negative – you fail to reject the null hypothesis when you should have (it’s false).
- Related to the probability beta (β); 1-β (inverse) is related to your statistical power.
- Statistical power is the probability that a hypothesis test correctly rejects a false null hypothesis.
- In essence, will the test detect a true effect?
Thank you,
Chris

