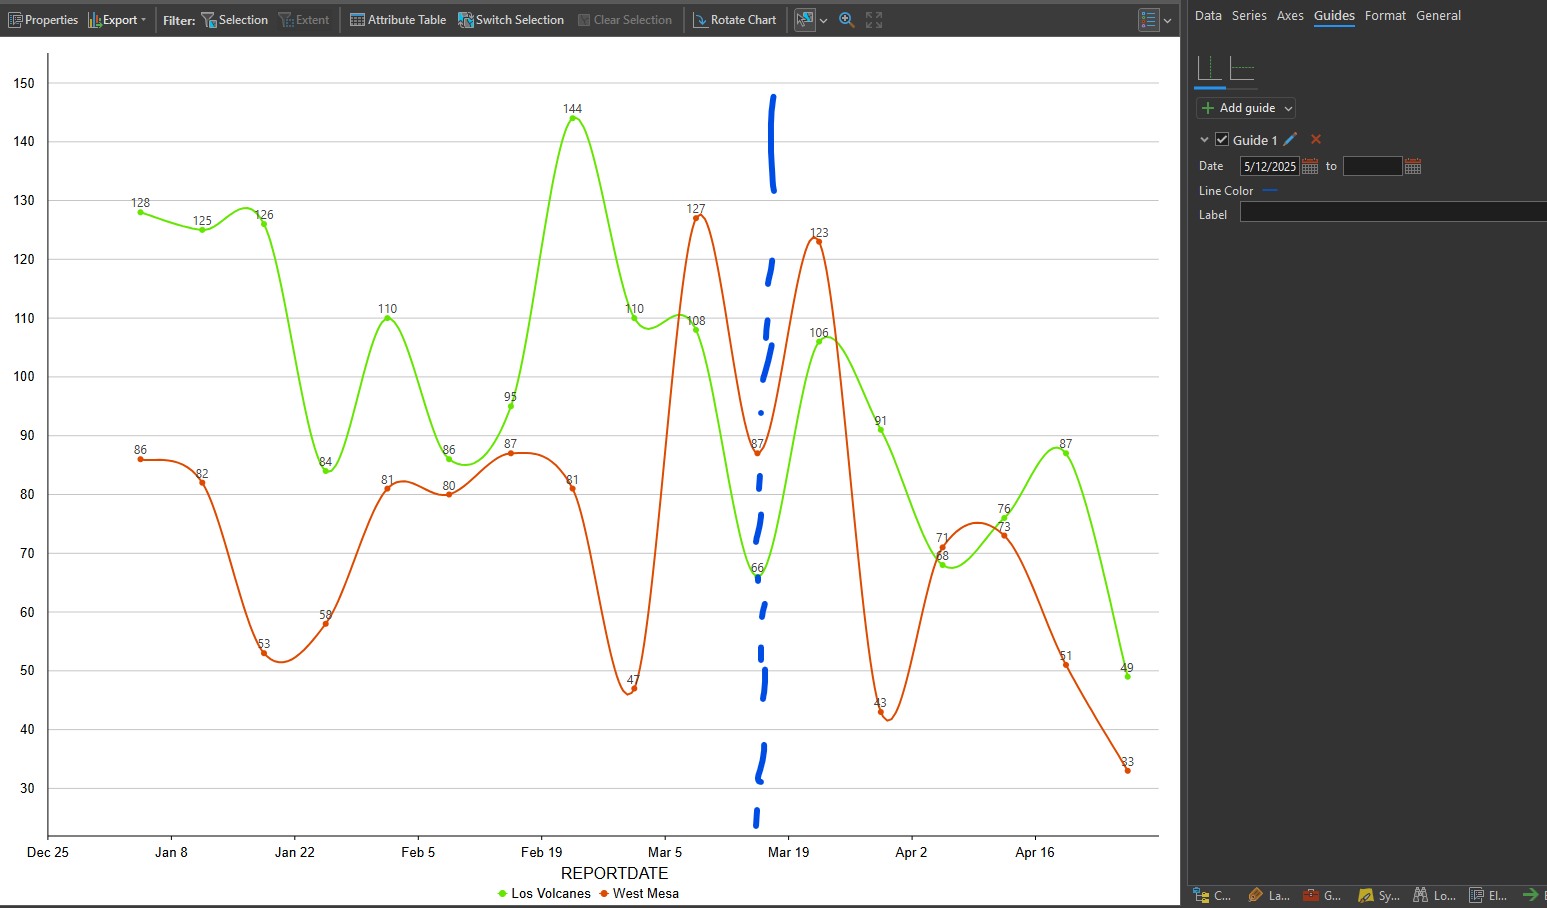
I thought it would be interesting to add a vertical guide to a chart to show a point in time when some changes that were made so end users could look at the chart and easily identify the 'before' and 'after' periods.. however when i add a vertical guide set to that date in this chart (approx where i added the dashed line), nothing is added. Maybe I am misunderstanding this capability. Thoughts?