Hi there,
I am using serial chart on operation dashboard. There are few filters applied on the serial chart. I noticed that when samll value (typically between 0 and 1) shows on the serial chart, y-axis value repeats itself. For clarification, I have attached two pics that illustrates the issue.
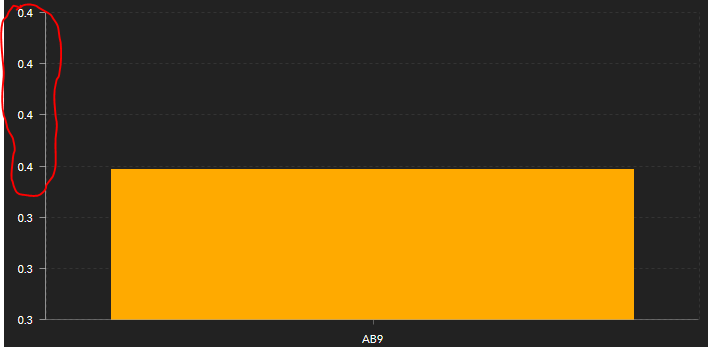
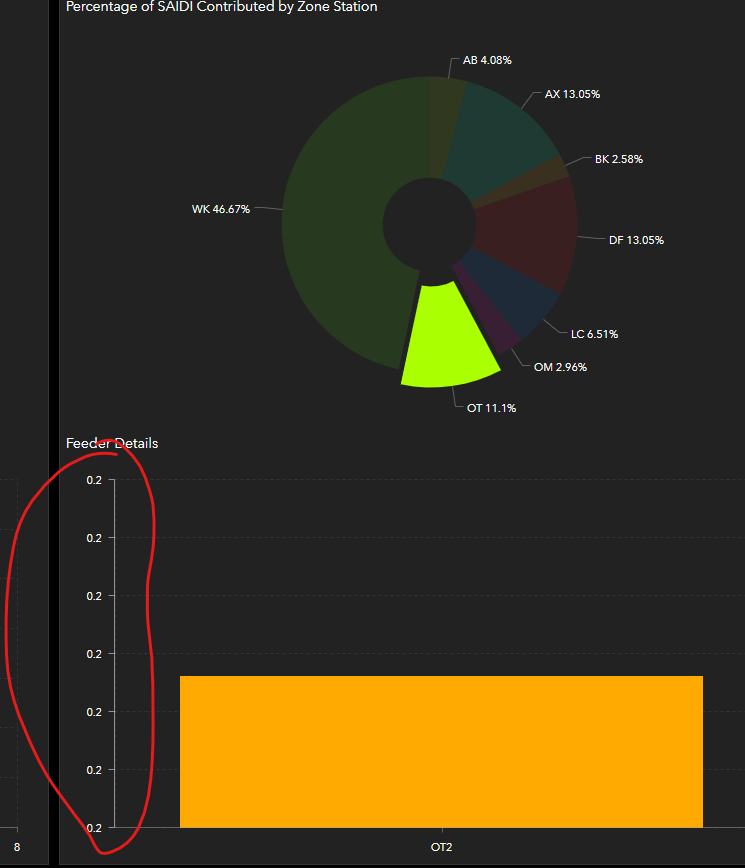
Minimum and maximum value of axis is set on automatic.
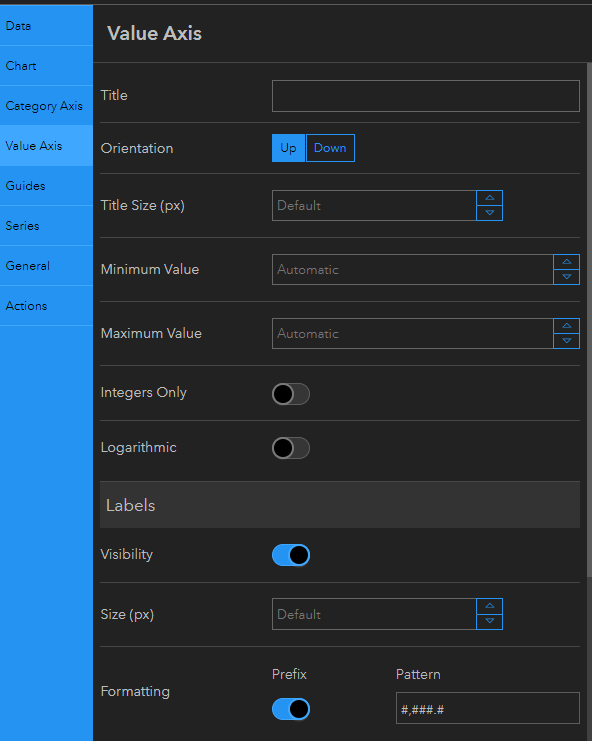
Could you please help me in fixing the issue?


