I have an API feed and a real-time analytic pushing data to a feature layer, and sending an email with a new incident alert. I was checking in on it today after a suspiciously low number of alert emails in the last 24 hours. There's usually 2 or 3 a day.
My real time analytic has been happily running so I thought, then again it seems it's behavior has completely changed as of August 13th at 3pm CST. Real-time analytic missed a new incident from 4am this morning, this means the API feed had the 4am incident but it wasn't pushed into the feature layer via the real-time analytic. The feed itself appear to be just fine.
Just wondering what this error might mean and why the real-time analytics logs look very different since. Is my real-time analytic ok?? It seems like it might not be.
| * Uncaught Exception in KS! Thread: 9cf14bc1a39347ababd9d71164d23056-1723226566982-debd474a-6b55-4fe8-aa88-9740d7033605-StreamThread-1-40 |
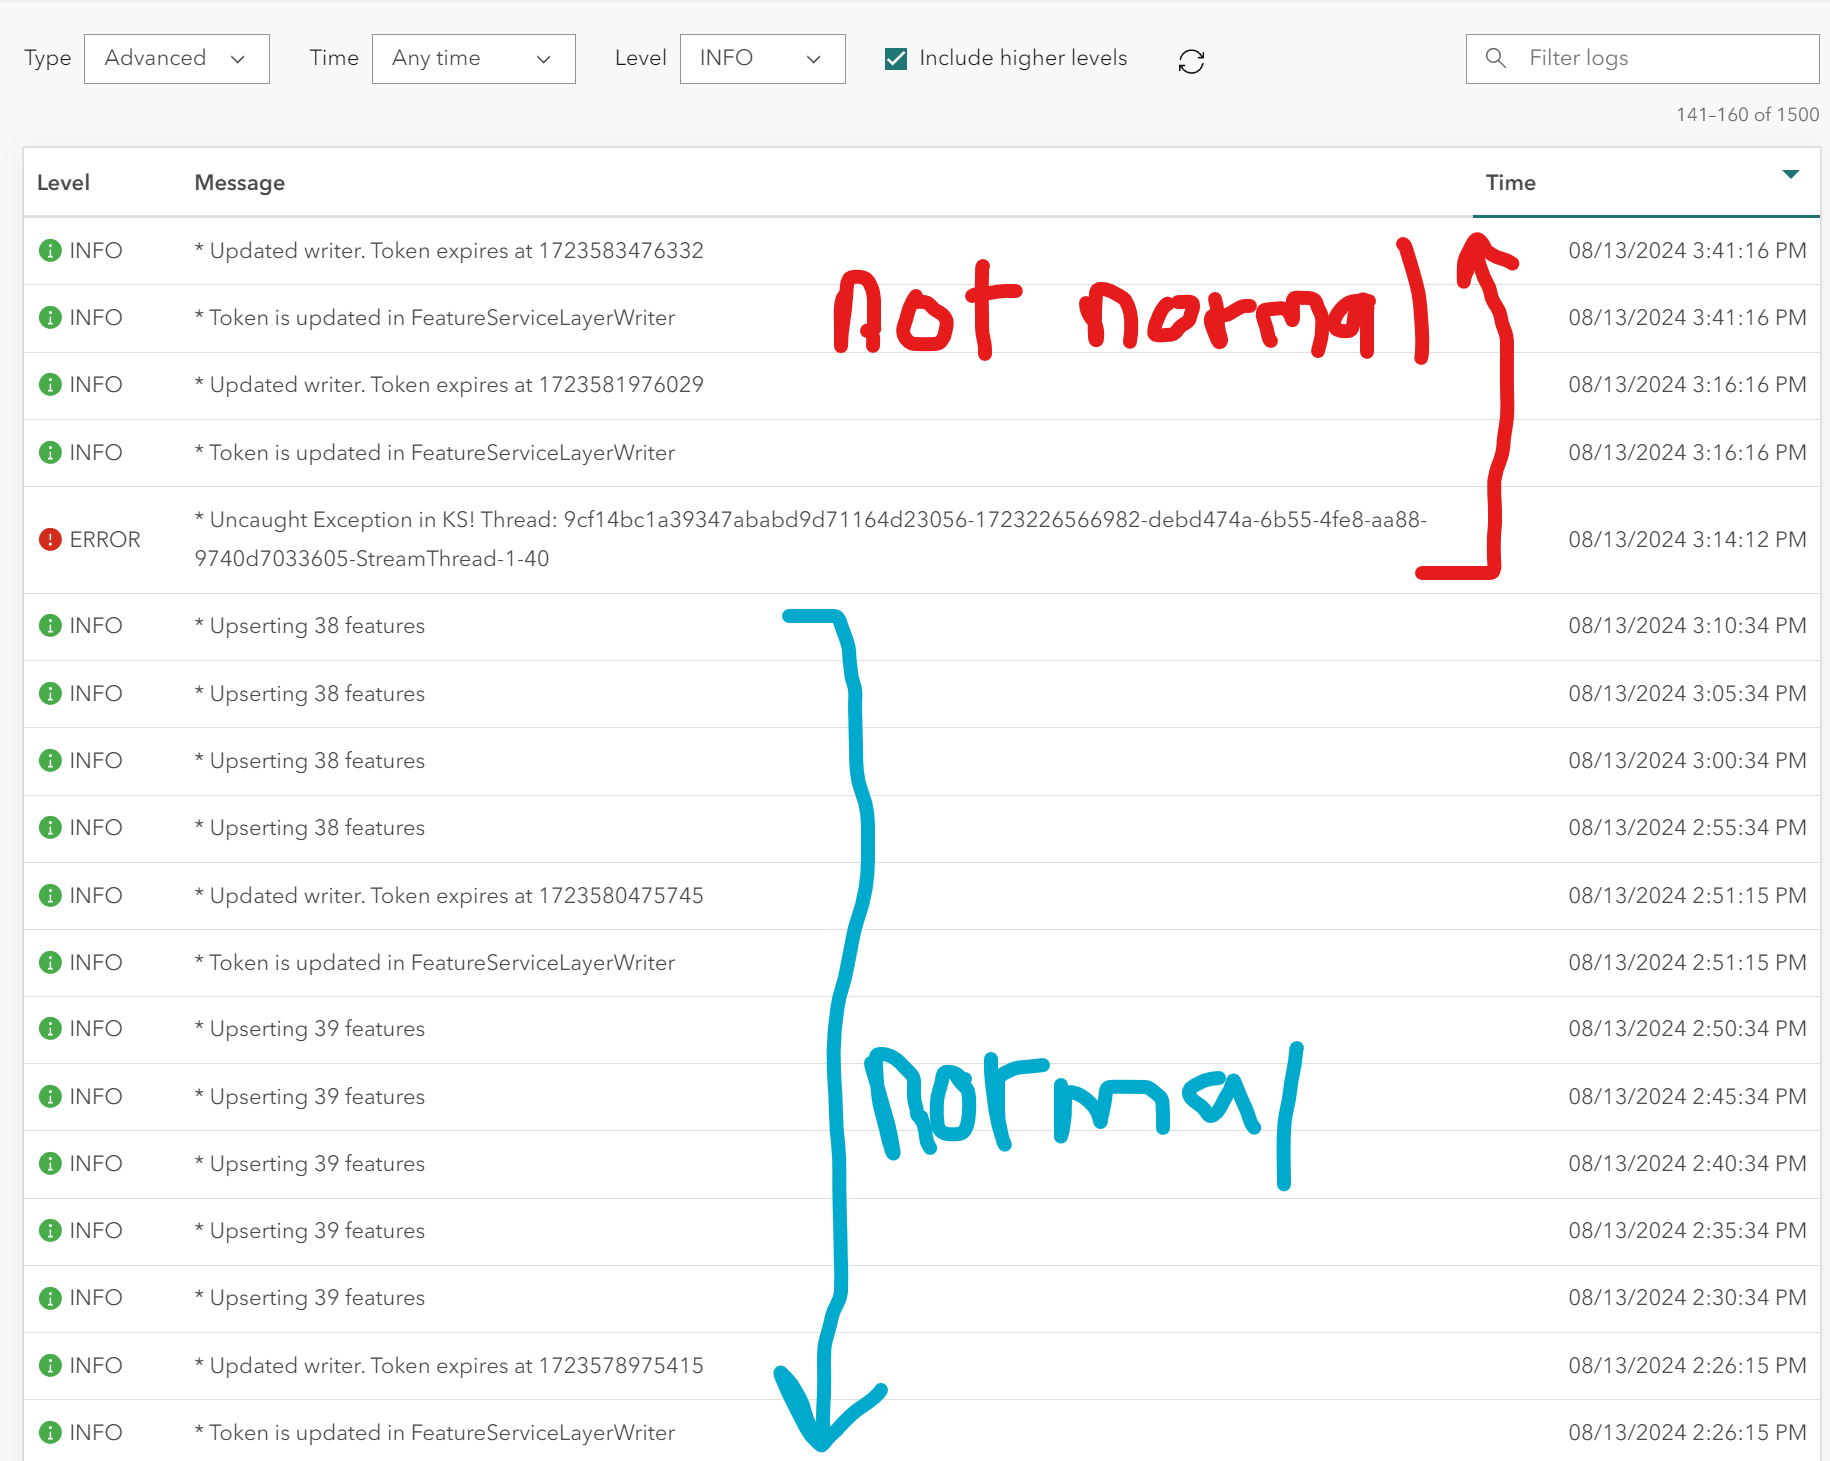
Following this error, there's no longer the normal *Upserting count features message, until I stopped and restarted the analytic this afternoon.
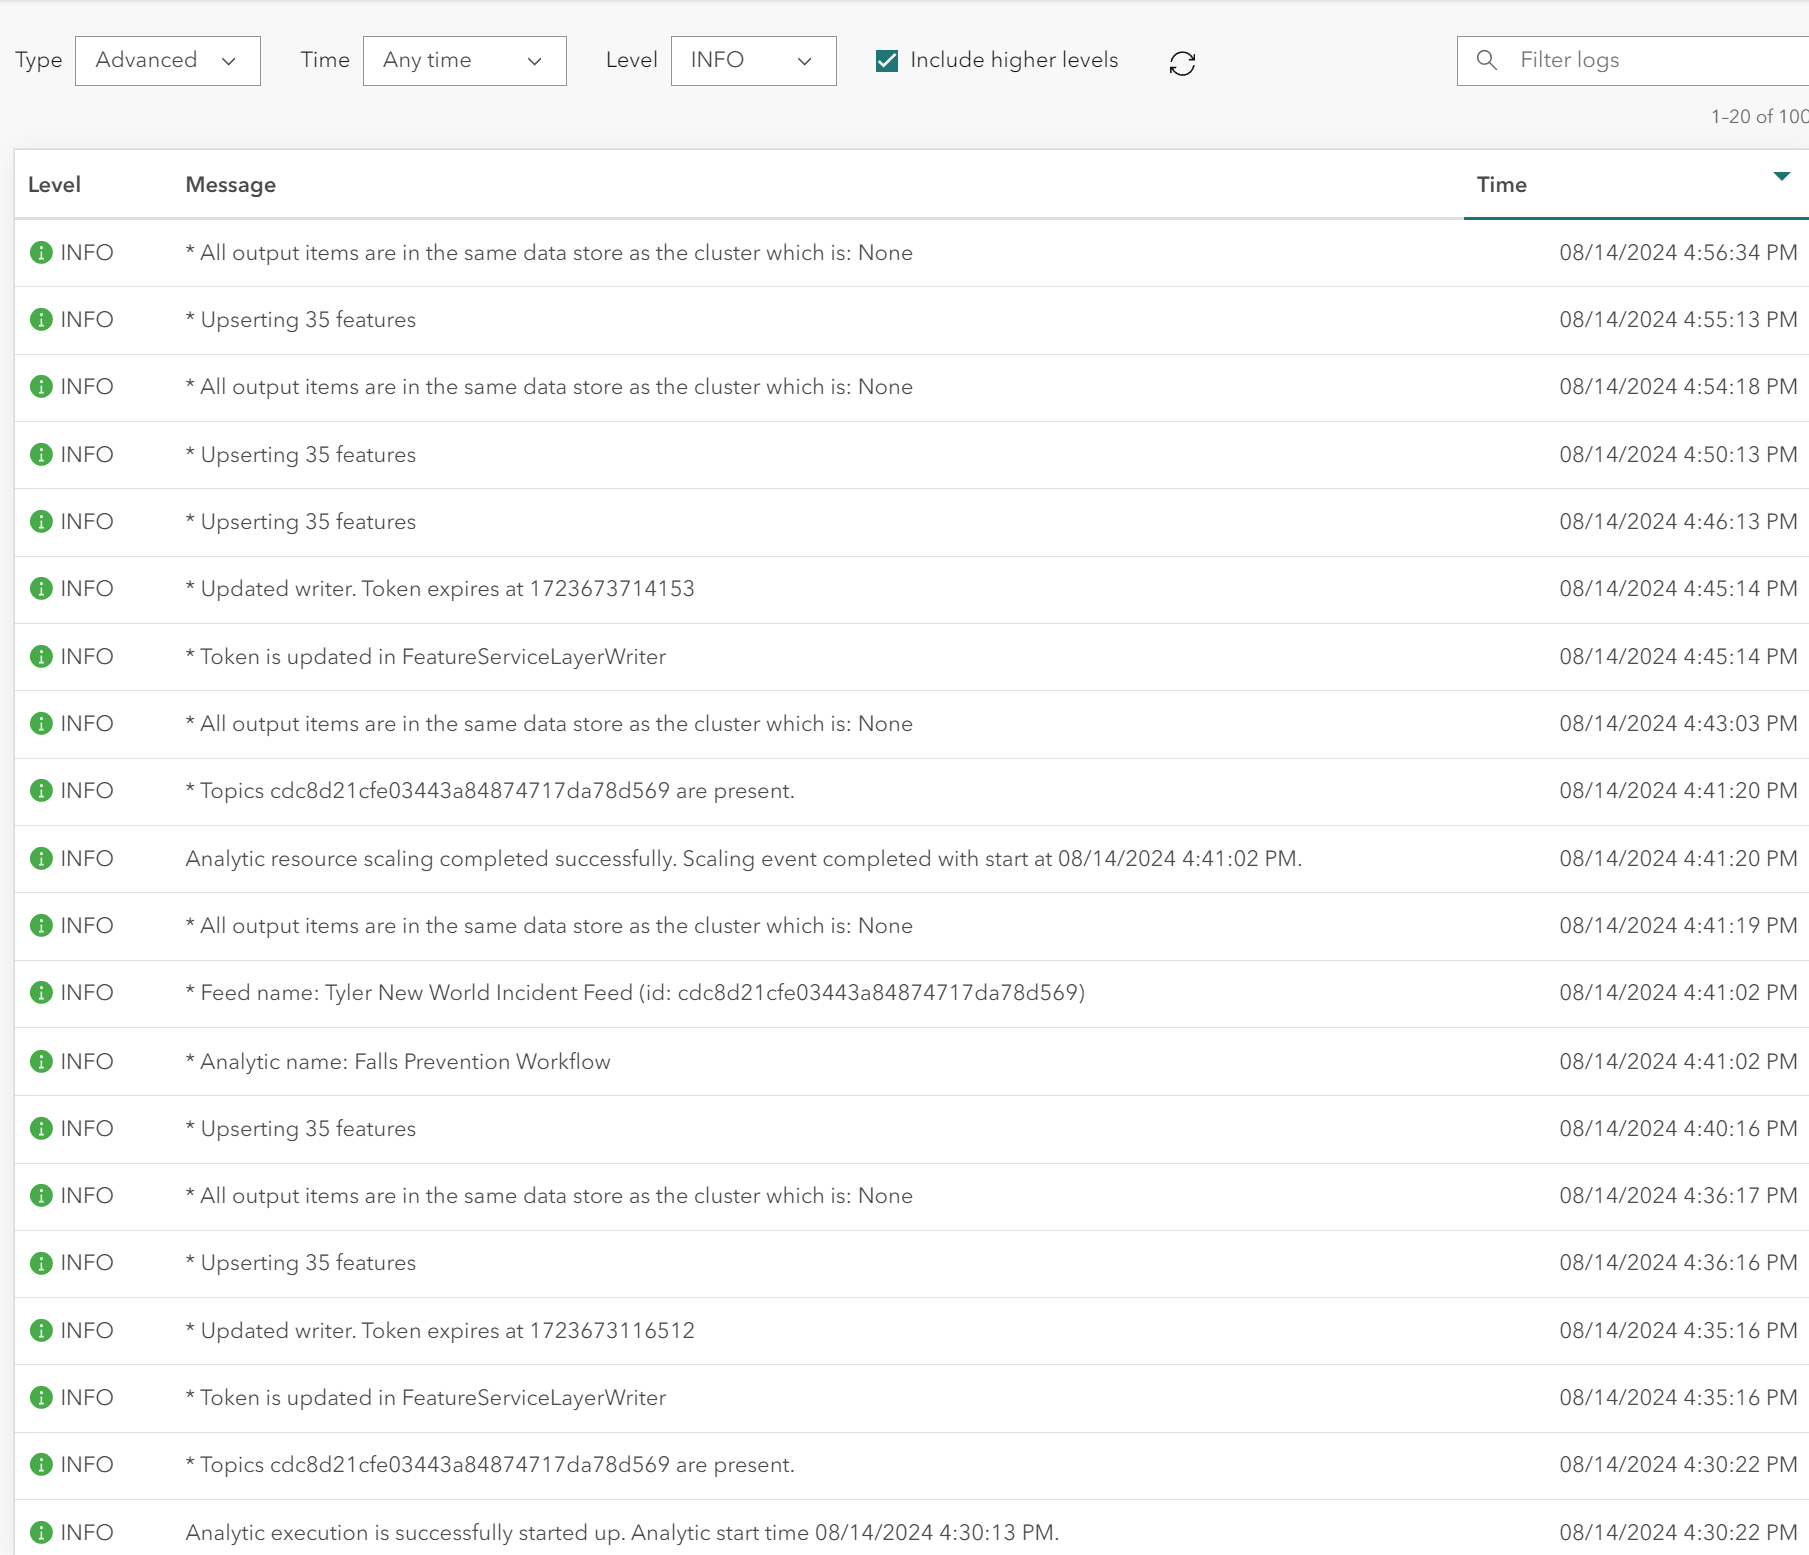
When I restarted this afternoon I keep getting this message I've never seen before:
* All output items are in the same data store as the cluster which is: None