Hello all,
I have an interesting project to generate insights about land use, and I haven't seen any similar examples. I started this project in Tableau but it doesn't seem to have the features required for this analysis, so I am moving to ArcGIS. I'm hoping this group can help.
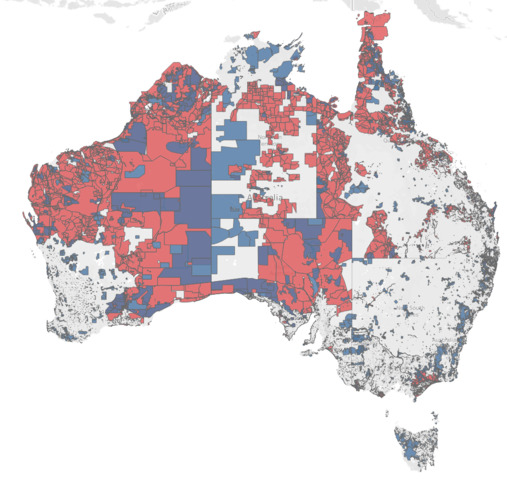
I need to do some spatial analysis of the land/surface area coverage of Australia, my home country. Australia has a land area of 7.7 million square km, and I've created a map with two layers (see above). Each layer shows a different set of restrictions on land use. But the two layers (red, blue) do have overlaps - i.e. some land has both sets of restrictions. I need to analyse the area (square km) of the map to understand:
- how much area is covered only by restriction A - depicted in red
- how much land area is covered only by restriction B - depicted in blue
- how much land area is covered by both restriction A and B
- how much land area is covered by neither A or B
That is a minimum, ideally I also need to be able to also generate those numbers for each of Australia's six states and two mainland territories. Ideally, I'd also like to add in subsequent layers as well and repeat the analysis.
The source data is two separate shape files, and each polygon within the files has area data associated with it.
Thanks for your help in getting started with ArcGIS!
AJ



