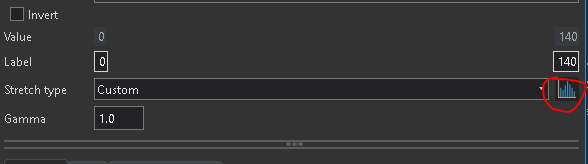
I have a raster of continuous data. Single band, sid format. I need to symbolize it by discrete colors with each color corresponding to a range of values, ie bin it. There used to be an easy way to do this in ArcMap with the classify symbology, it was buried somewhere in the histogram if I recall correctly, but it was quite simple. You could just tell it how many ranges you wanted, set the breaks and that was it. I can't find anything to do this is Pro. Is this still possible in Pro? I can get to the historgram but it doesn't appear to have the options I need I just want to bin the data, not transform it.