I'm trying to figure out how they created the interactive horizontal timeline in the example linked below.
Example: The lines that shape our cities (arcgis.com)
ESRI's standard timeline feature only works vertically.
Using inspect- I can't tell if they use another application and then add it in an iframe or if its a secret mode in Storymaps.
Horizontal Timeline (esri.com)
<iframe role="application" src="https://storymaps.esri.com/stories/2020/redlining-timeline/timeline-horizontal.html?table=appbcUwhFABWv4pnV/Table%201&token=keyLOzxOfPFy0ISGv" allow="autoplay" sandbox="allow-scripts allow-same-origin allow-forms allow-popups" allowfullscreen="" title="" tabindex="0" loading="lazy" class="jsx-3625881117 "></iframe>
Example: The lines that shape our cities (arcgis.com)
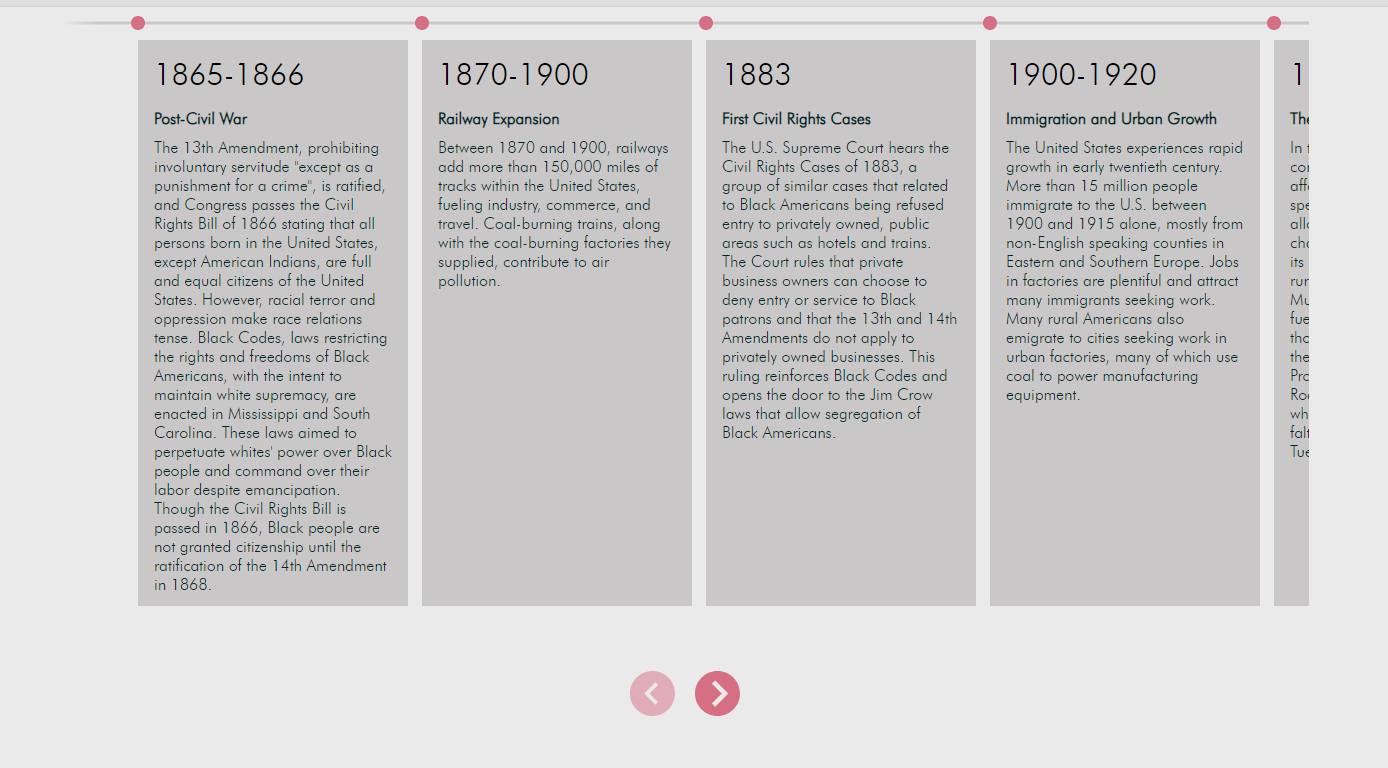
Any thoughts on how they did it are welcome.

