Hi everyone,
First time posting here, so please let me know if I am missing anything! My question is more a general technical question on the best way to create a slide bar for a single variable on my map in experience. I am not hard stuck to experience but had already started some work on there. However, my example image comes from Arcgis Dashboards.
For example, I want to select a region on my map. ( reduced the map to that region) Then a slide bar ( Similar to the one shown in the image) that helps pick how much of the variable I can see.
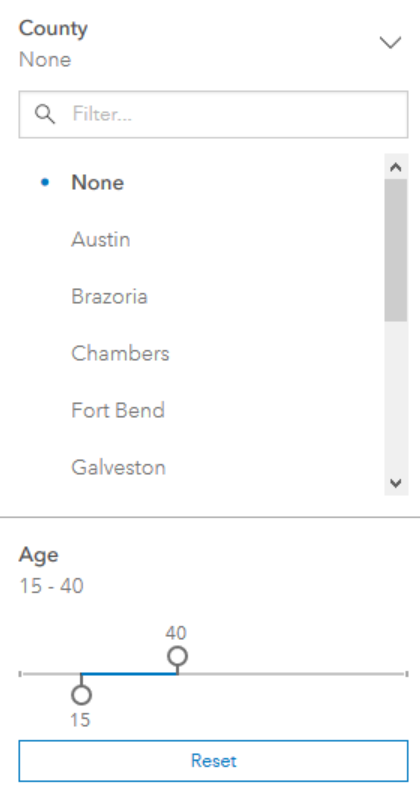
Similar to this image but instead of county it would be CMA ( Major Cities) and instead of age it would be a variable like temperatures.
Looking forward to the response! Thanks!

