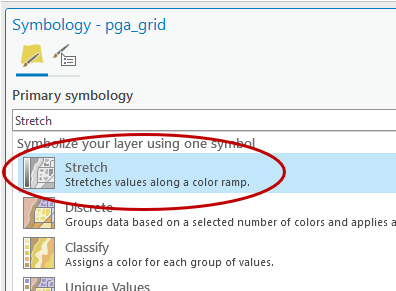
This idea relates to the the "Stretch" symbology for raster layers in Pro:
Problem: The color scheme editor only lets you set colors based on the percent position in the range of values. For most maps I make, I want certain colors assigned to specific values, rather than the percent of the range from min to max.
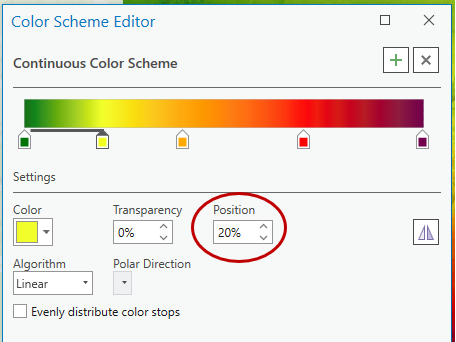
Idea: Give us the option to enter specific cell values where the colors change in the Color Scheme Editor (see previous screenshot). This would be in place of the percent "Position" setting if I'm using cell values. It should be able to accept float values with decimal places, since I work with some very small decimal values. I would also like the values to be able to be outside the range of whatever grid I'm working with, since I might have a greater possible range than just this dataset.
The work-around: I can create an artificial raster with the theoretical min/max values I'd encounter. Then, I calculate the percent values that correspond to the actual cell value thresholds where the color should change in the continuous color scheme. Next, I apply that symbology to another raster layer and it will maintain those ranges. So I have a work-around, but... why do I have to do all this work! Make it easy for us!
Example: On a temperature forecast map, you'll see the same legend every day, even though the range of daily temperatures might vary greatly by season. I just want to make it as easy as possible to create a new color scheme based on grid cell values for the color transitions, rather than percent of the range in that particular grid, which might not reflect the true range of values I will encounter in future data sets.



