I posted a similar question two weeks ago here. I must be missing something.
How do I get the Summary Reports GP Tool's Area Description parameter to work, as in appear in my output?
Here's what I'm doing:
- Author a custom infographic with 1 image, 2 texts, 1 graph using 200, 2010, 2020, 2023, and 2028 population, and 1 comparison table with Places Sample data and Counties Sample data.
- In BA Desktop, import the info graphic from my content > report templates > right-click > Import Template
- Open GP Tool, Summary Reports. Set these parameters:
- Boundary Layer - Set to a feature layer with a layer def query w/1 feature
- Create Reports - Choose the imported infographic from step 2
- Output Folder - default
- Summarization Options - Individual features, Single Report Checked On.
- Report Output Formats - Checked On
- Area Description Field - set to a field with a name (eg: some town)
- Click Run. Result: The PDF is created, but my site name is not populated from the Area Description field.
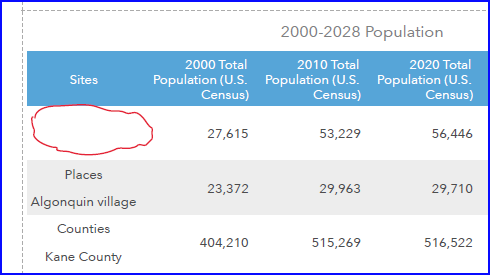
How do I get my site name into that empty cell?
I know I can wrap this tool in python, and before invoking it, parse the report.xml, and insert my site name into the xml. It just seems like Area Description should work.

