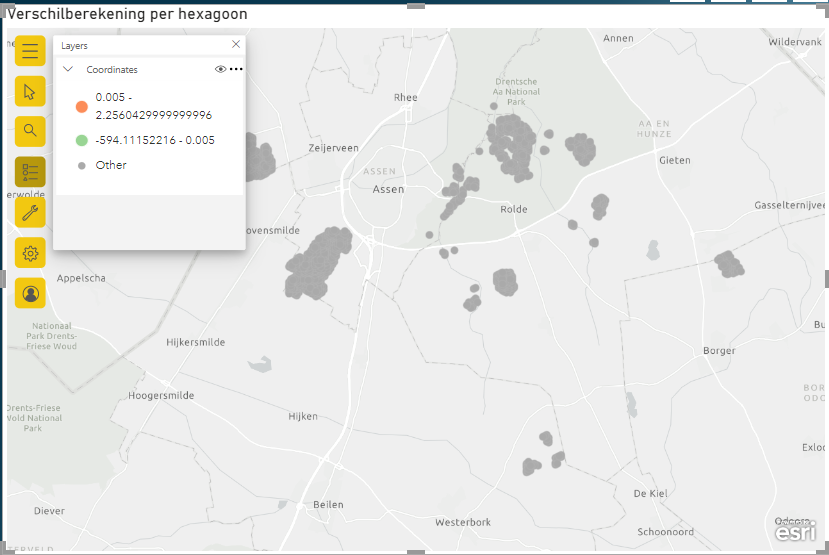
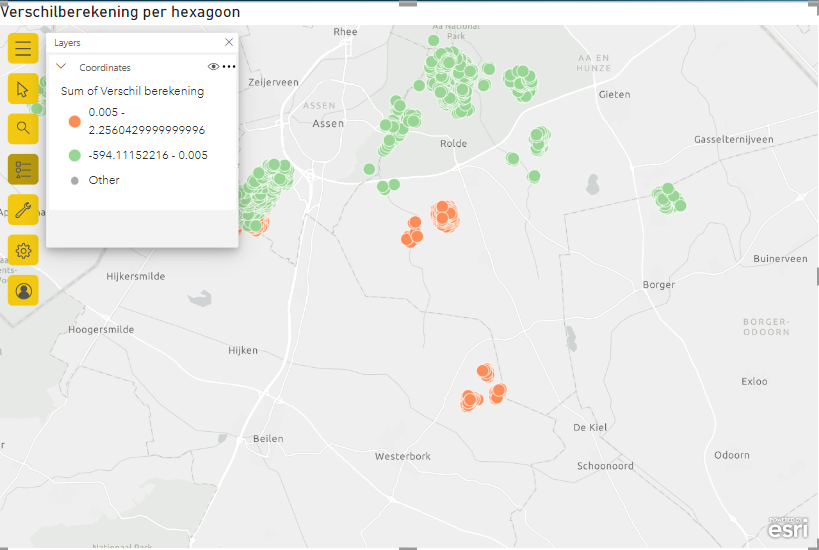
I have a dashboard that I need to present soon so I uploaded the dashboard from desktop to the online version. However, after doing so it seems that symbology has changed or something. Before exporting (as can be seen in the second image) all data is displayed in either green or orange points, but with the exported data all the datapoints are now grey. How is this possible and how can I change it?
Thanks so much in advance!