Hello,
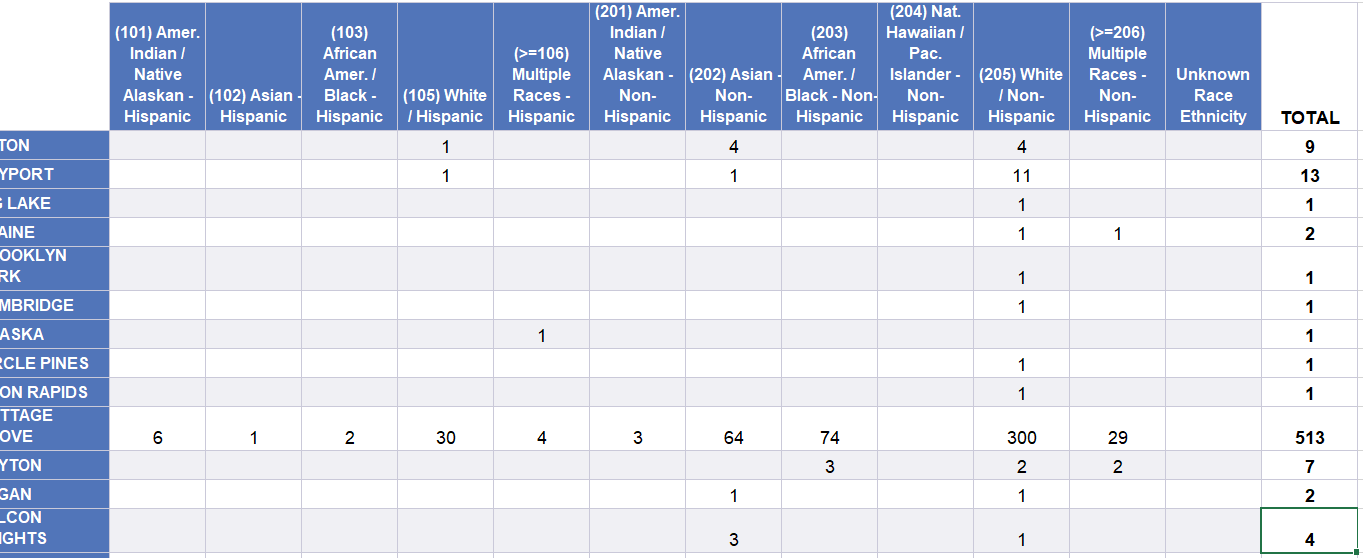
I have been given a spreadsheet that has counts based on services received in cities across our county. Is there a way if I apply a layer that has the geographic border of the county to then manually enter these counts associated with a city on the map to have dots based on the number of individuals receiving services? And taking it one step further could I do different colors by race/ethnicity or would I have to create a separate map for each R/E?