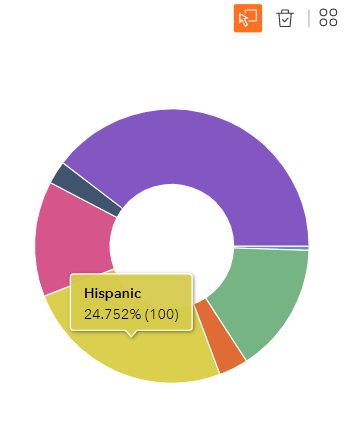
Does anyone know how to modify the format of the data pop-ups when selecting or hovering over charts in Experience Builder? Specifically, I'm showing a pie chart where each category is expressed as a percentage of the total when hovering over it. I'd like to change the number of decimal points that are shown on the percentage - currently three decimal points, but I'd like to round to the nearest tenth (see screen shot). Is there a way to do this?