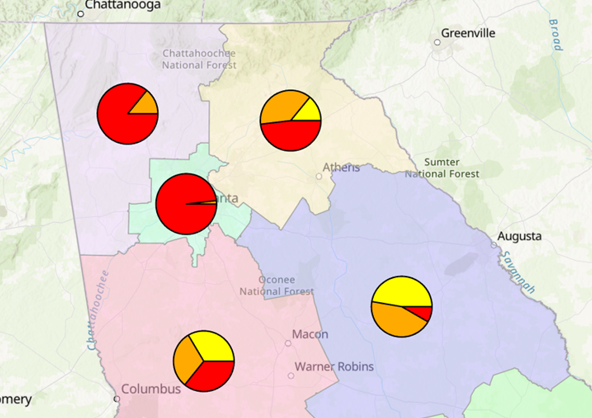
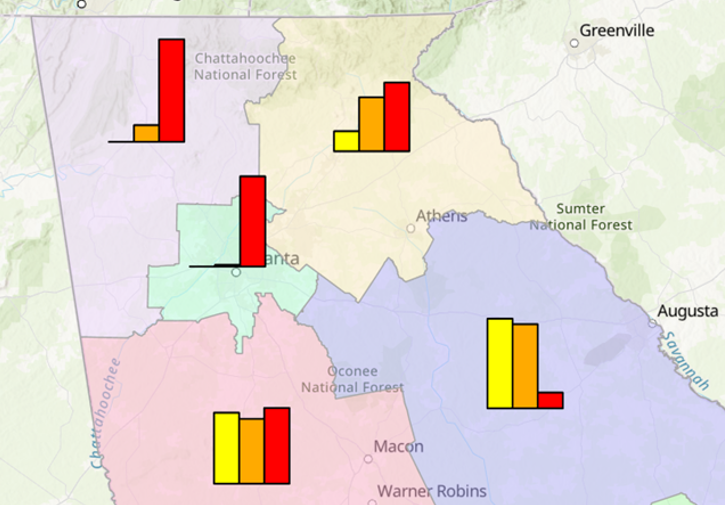
Anyone knows how to use ArcPy to define the pie or bar charts symbology like the ones shown in below? I could not find any examples or documentations that describe this. Some community experts mentioned "the number of people using pie chart symbology in python code is probably not a huge target audience." So, I guess there are some functions but not popular. Anyone can help? Appreciated!