Hi guys,
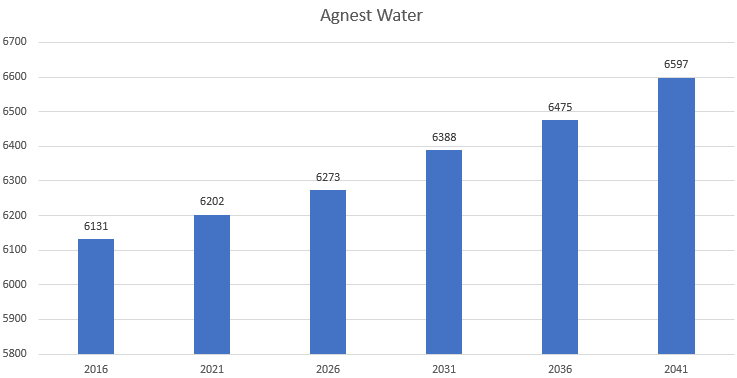
Fairly new to ArcGIS dashboard and Arcade Expressions. I am trying to create a serial chart by displaying population by year. However in the serial chart tool, it can be only be displayed from a statistical point of view. I just want to display the figures as it is by year.
Raw data (see below)

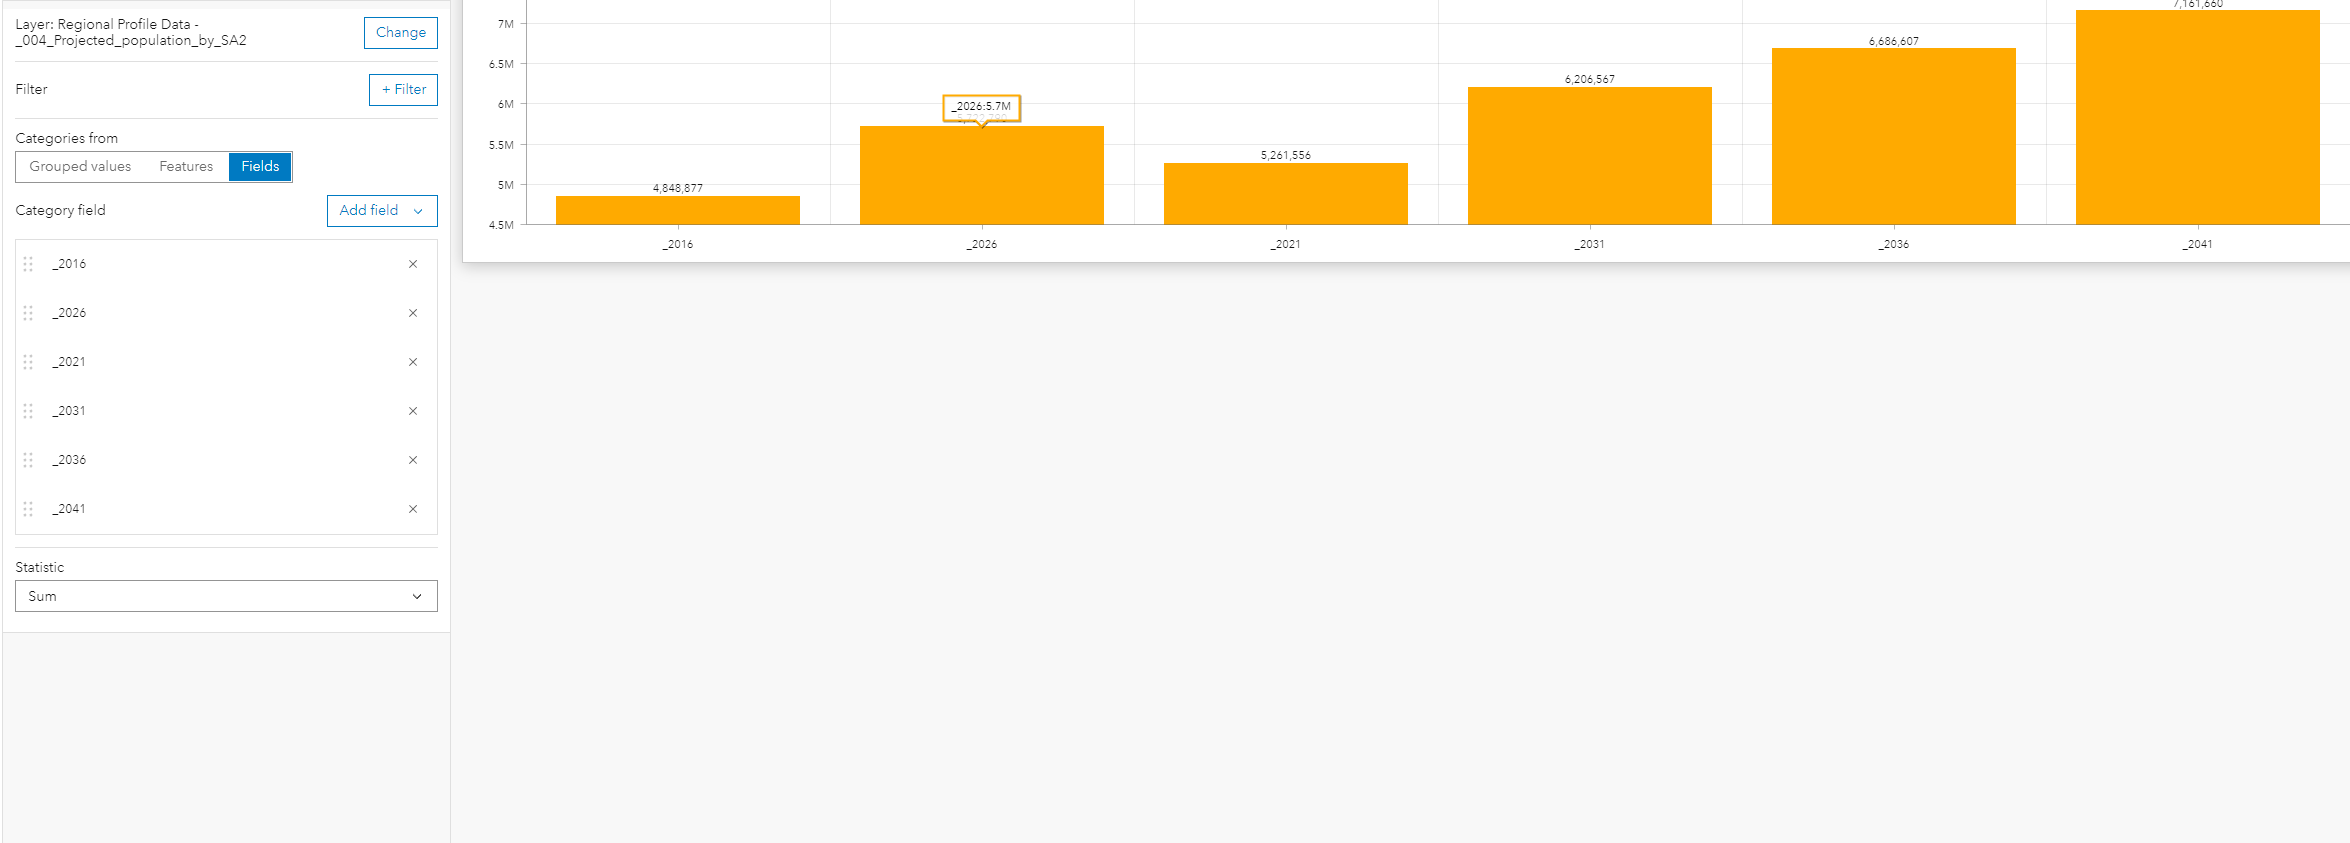
Current serial chart setting (see below)
How I want to display the data (See below)
Can someone please provide some assistance.
Thanks.



