Good day all,
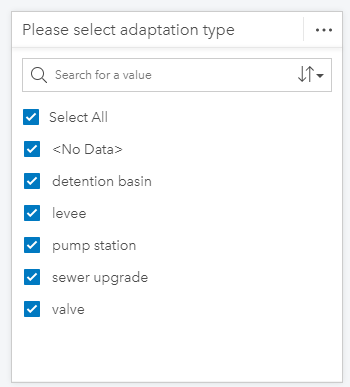
I am trying to create some plots from a text column which has categorical values. Now when I add a filter for this column, the filter does pickup every value as shown below:
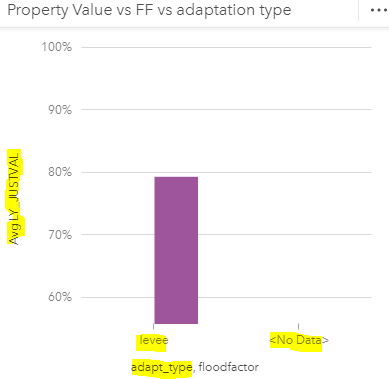
However, the plot is only picking up `levee` and `No Data` which is an odd behavior.
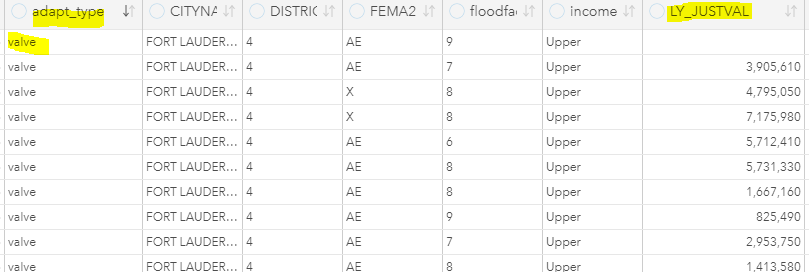
Every categorical value in the adapt_type column has a value in the `LY_JUST` column. Even the snapshot of the datatable shows that for example adaptation type `valve` has `LY_JUSTVAL`.
How can I fix this?

