Hi,
How do I create a chart showing a count of one field based on another field.
For example below I have salmon appearing 3 times with the total count of 5. I'd like the chart to show Salmon 5, Pike 4, Rudd 10, Perch 3 etc. rather than just counting the species field.
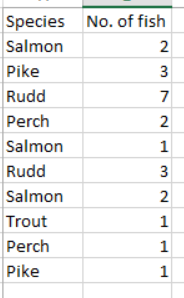
If I use Grouped Values it only lets me select the Species and the number of times they appear rather than the number of fish field.
Thanks
Rachel




