I recently came across the blog post on using Arcade to summarize data in cluster symbology pop-ups using information from aggregated features (https://www.esri.com/arcgis-blog/products/arcgis-online/mapping/summarize-and-explore-point-clusters-with-arcade-in-popups/). Using the solution in the example that's demonstrating a table of custom attributes (section 4 in the post), I essentially copied and pasted the example Arcade into the Arcade set up in my web map for clusters, and swapped in the relevant field names. I'm getting empty elements in the table at every level... checked four times for typos.
In this dataset, there are a bunch of points representing port surveys of fisherman. The points each have a bunch of info about day and location where they fished, what species they were targeting, and how much they caught and harvested of that target species. I'm trying to get the cluster pop-up to provide harvests and catches by target species of the aggregated features (for use in a dashboard where folks can filter on attributes like port and date). Here's the code I'm working with to try and get a table of Harvest by TargetSpecies from each aggregated cluster:
Expects($aggregatedFeatures, "TargetSpecies", "Harvest")
var attributes = {};
var fieldInfos = [];

var statsFS = GroupBy($aggregatedFeatures,
  [
    { name: 'species', expression: 'TargetSpecies'},
  ],
  [  // statistics to return for each unique category
    { name: 'harvest', expression: 'Harvest', statistic: 'SUM' },
//    { name: 'num_features', expression: '1', statistic: 'COUNT' }
  ]
);
var ordered = OrderBy(statsFS, 'harvest DESC');

for(var f in ordered){
  var type = f.species;
  attributes[type] = Text(f.harvest, "#,### harvested");
  Push(fieldInfos, {
    fieldName: type
  });
}

return {
  type: "fields",
  title: "Total harvested by species",
  attributes: attributes,
  fieldInfos: fieldInfos,
}
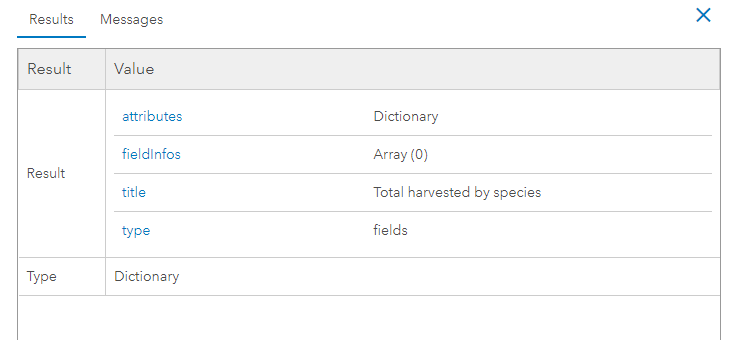
And the result:
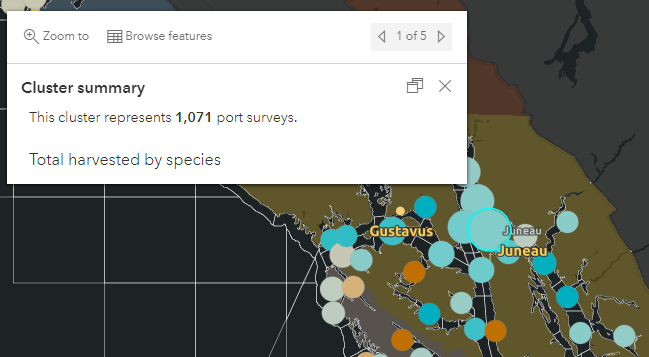
And the view in the pop-up:
Does anyone have thoughts on why this may not be working based on the info I shared?



