Hello,
I am fairly new to learning JavaScript but I have started using it in surveys when I need to do more complex calculations. I received a request from the client today and what they want to do is to generate a graph dynamically within the survey interface, as the user enters data for a cross section. It would ideally look something like this:
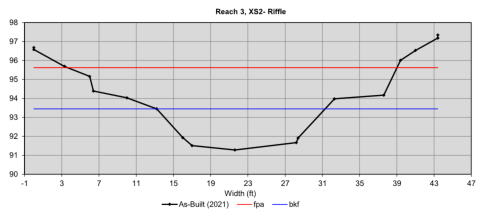
Is it possible to do this in Survey123 using JavaScript? (or any other solution?) I've read a little about the JSCharting but a more broad question is...is it possible to use libraries like this at all within Survey123?
Thanks in advance for any advice!
-Katherine



