Hi everyone,
I have two features I want to compare by making a scatterplot to show the relationship between them. One is a set of ground truth waypoints of trees and another are points that I classified through image processing and converted to waypoints. I would like to see if there is a relationship between the two of them but am having troubling figuring out how to do so.
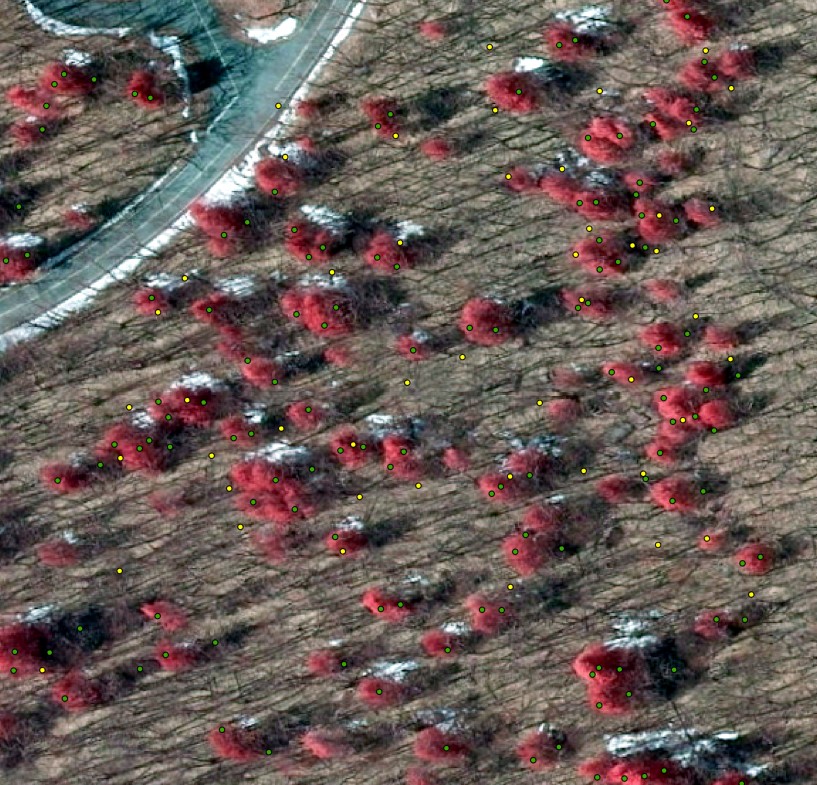
I attached a screenshot of my situation...the yellow points are ground truths and the green are what I produced. I would like to see how closely related (spatially) the two are to each other. Any workflows on how to do this are greatly appreciated!
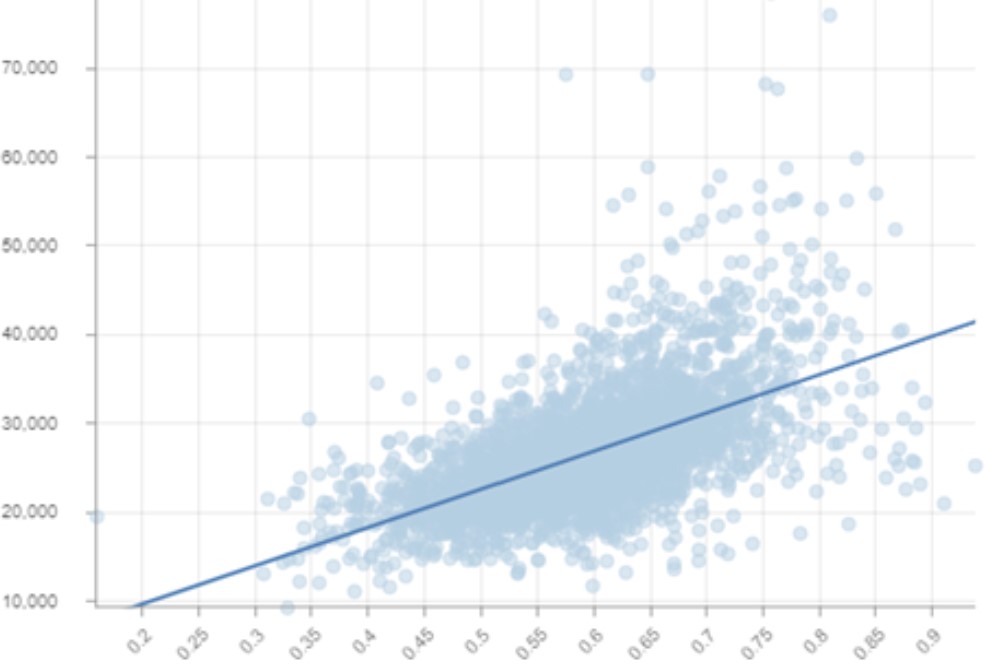
Ideally, I would like to produce something like this...with each axis representing the two waypoints I have.
Thanks,